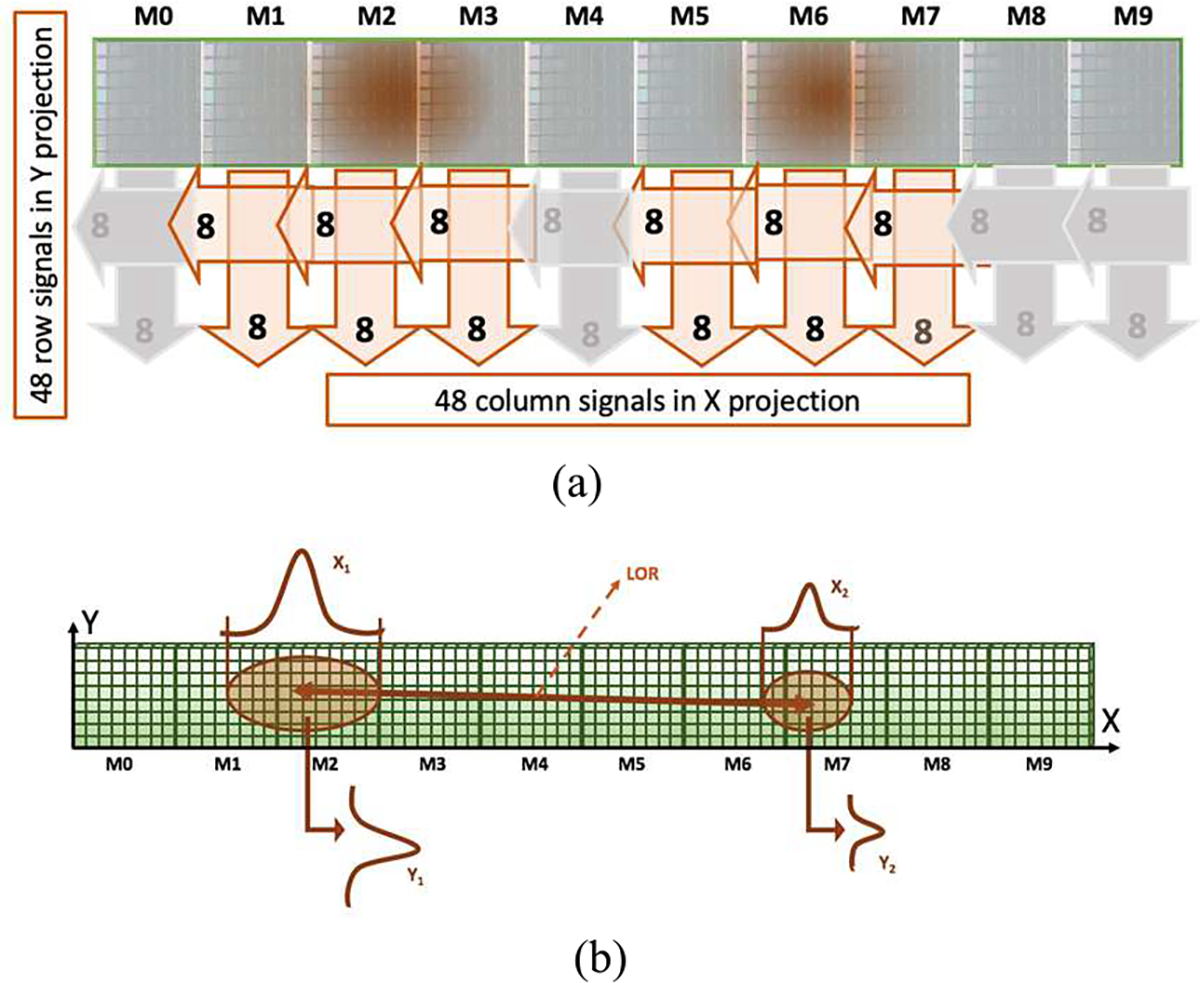
Fig. 2.

(a) Projection readout implemented providing 8 + 8 signals for each SiPM array. The dark areas represent the scintillation light generated due to the interaction of the annihilation photon with the scintillator material. In this example, the coincidence event has been detected by the arrays corresponding to M2 and M6. The signals of these arrays plus the signals from the adjacent ones (M1 and M3 for the event detected at M2; and M5 and M7 for the event detected at M6) are also processed. (b) x and y projections of a coincidence event. The xi coordinates (along the ring) are calculated as the projection of the columns while the yi coordinates (along the axial axis of the scanner) as the projections of the rows containing the maximum value of the distribution. Notice that both sketches show the tube unfolded.
