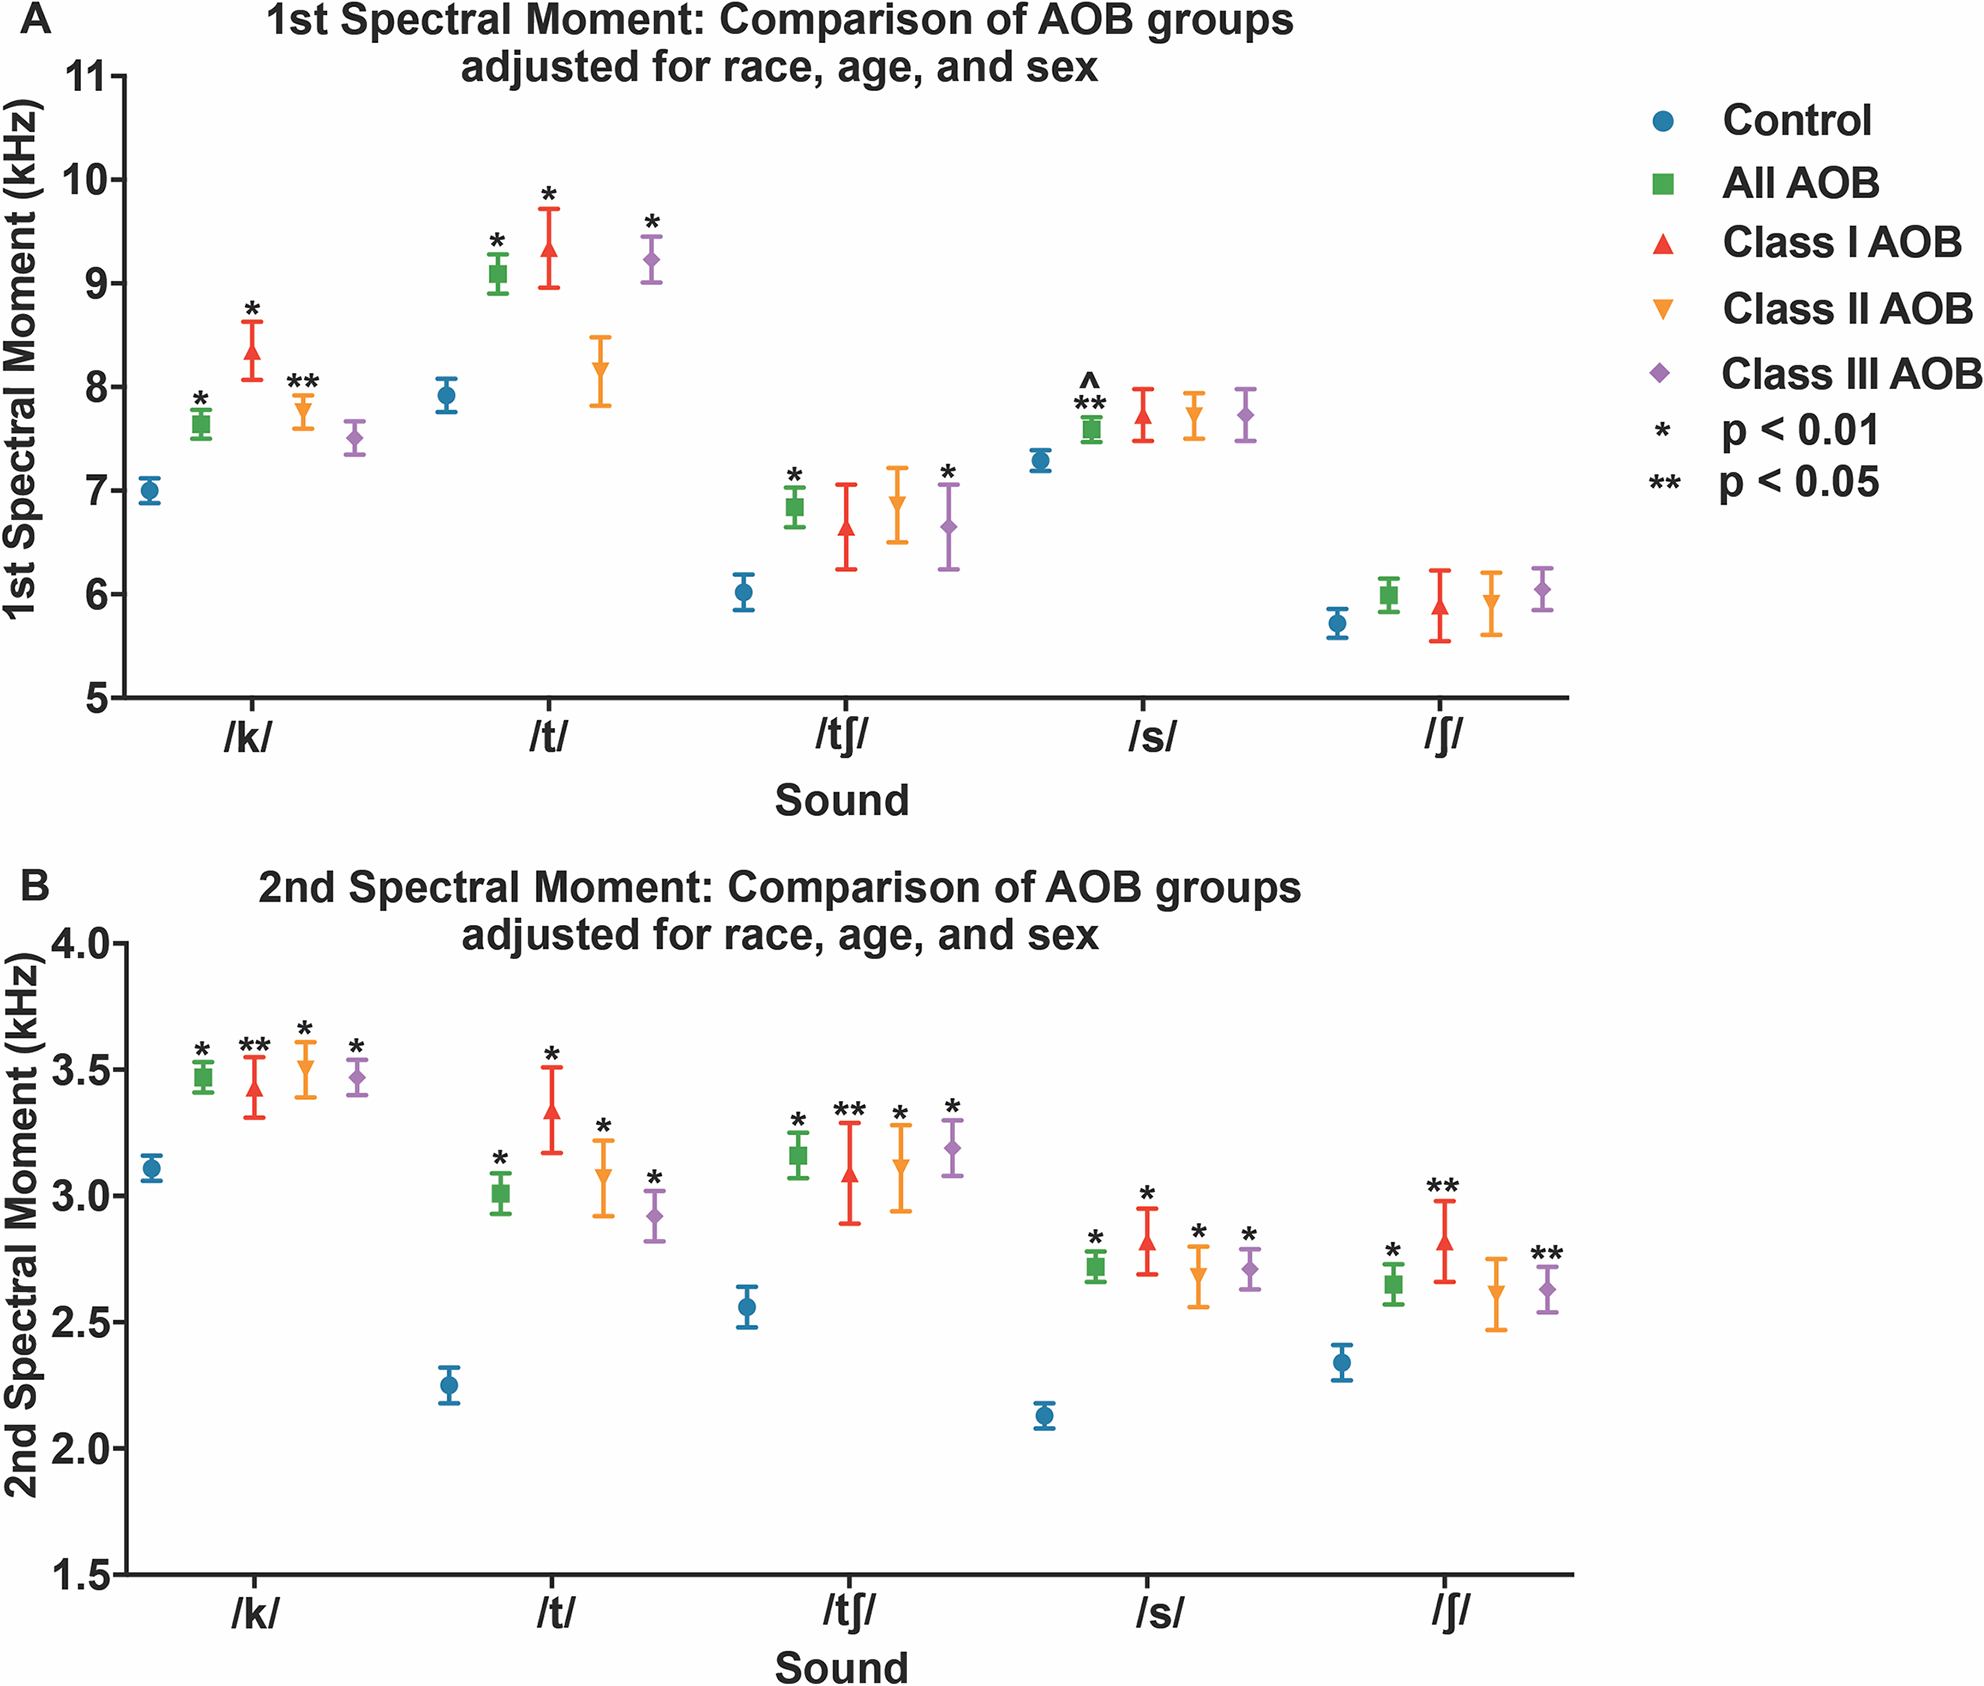
Figure 4:

1st and 2nd Spectral Moments for patients with AOB DFD and Class I controls, adjusted for race, sex and age. [A.] 1st Spectral Moment / Mean Frequency (M1) by sound. [B.] 2nd spectral moment (M2, standard deviation = variance) by sound. Blue circle: Control. Green square: All Class III DFD patients. Red triangle: Class III DFD patients with positive (+) overbite. Orange upside down triangle: Class III DFD patients with an anterior open bite (AOB) or negative overbite. Bars represent standard error. Conventions: * p< 0.01 significant by Bonferonni adjustment. ** p<0.05. îndividual comparison has significance but no type III group significance (p>0.05). ^^ type III significance 0.01<p<0.05.
