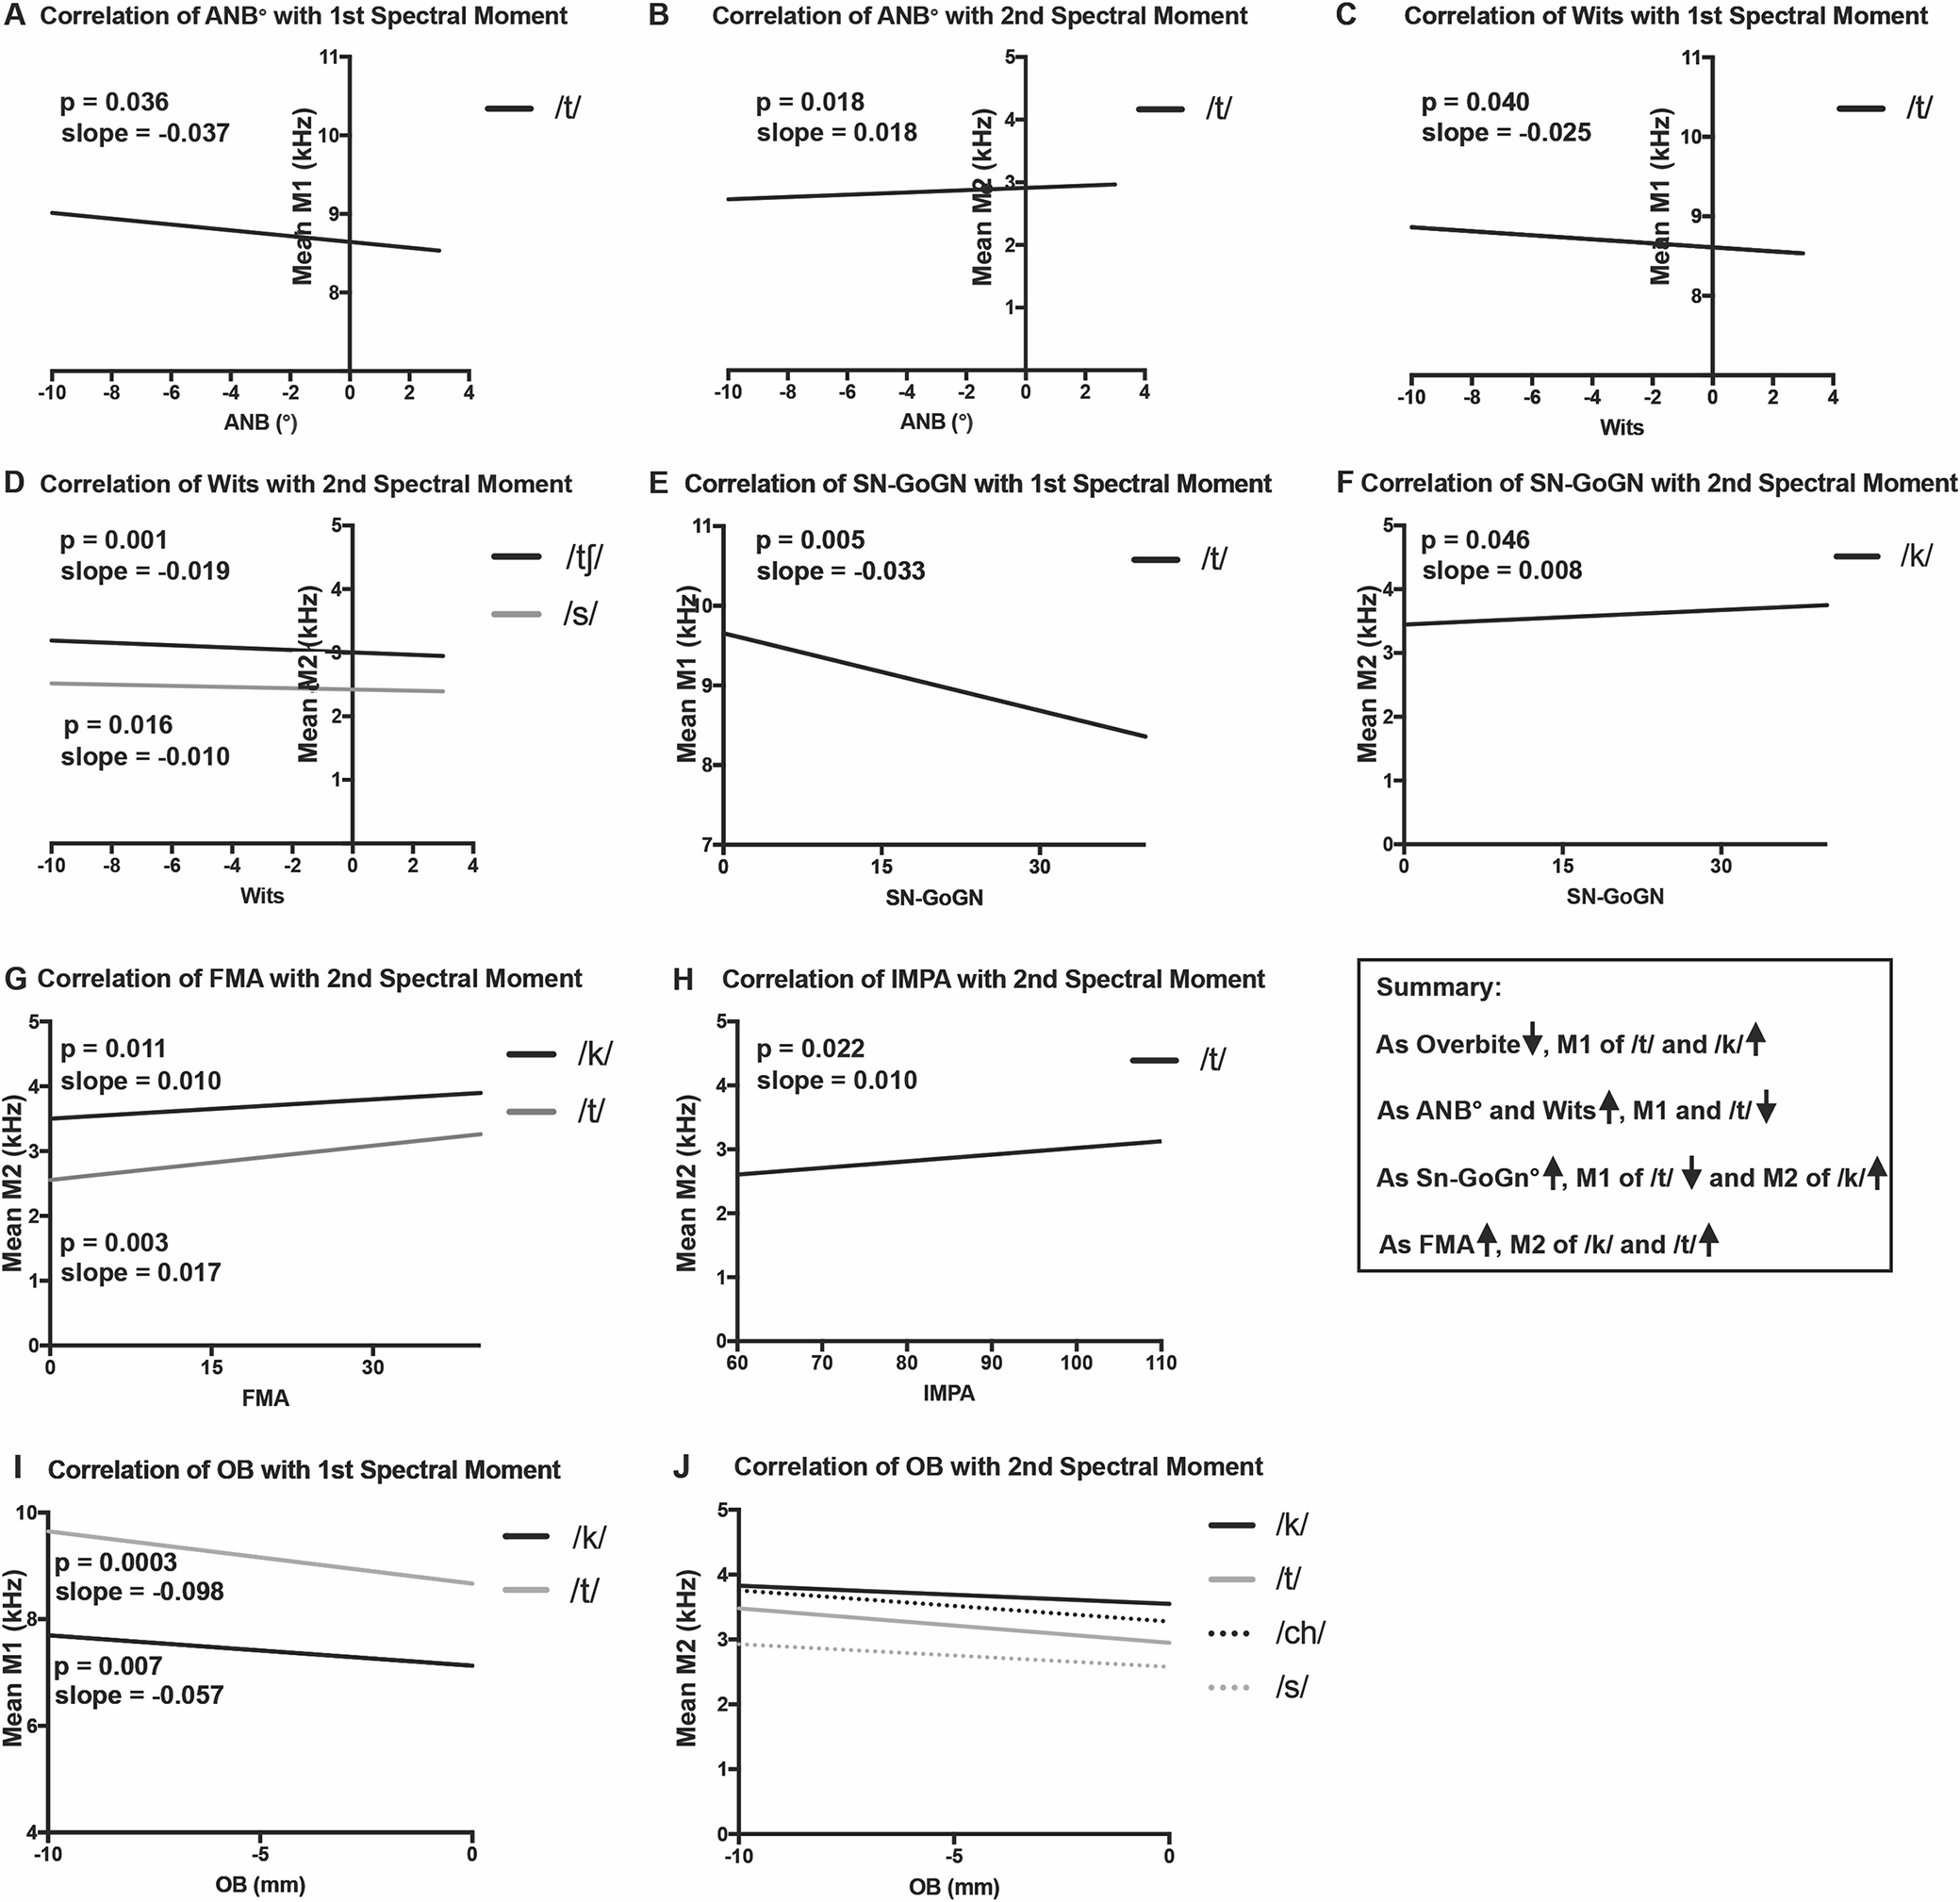
Figure 6:

Regression plots of significant linear trends for patients with DFD and Class I controls, adjusted for race, sex and age. Spectral Moments from DFD patients (Class II, III, and/or AOB) and controls plotted as a function of cephalometric and occlusal measures, for all relationships that are statistically significant (p<0.05). A. Correlation of ANB with the first spectral moment (M1). B. Correlation of ANB with the second spectral moment (M2). C. Correlation of Wits with M1. D. Correlation of Wits with M2. E. Correlation of SN-GoGn with M1. F. Correlation of Sn-Go-Gn with M2. G. Correlation of FMA with M2. H. Correlation of IMPA with M2. I. Correlation of OJ with M1. J. Correlation of OJ with M2. P values and linear slopes are specified on the graphs for A-I. For J, consonant values follow (P value, Slope): /k/ (0.0072, −0.01877), /t/ (0.0377, −0.01823), /ch/ (<0.0001, −0.02387), /s/ (0.0001, −0.02387), /sh/ (0.0049, −0.01927).
