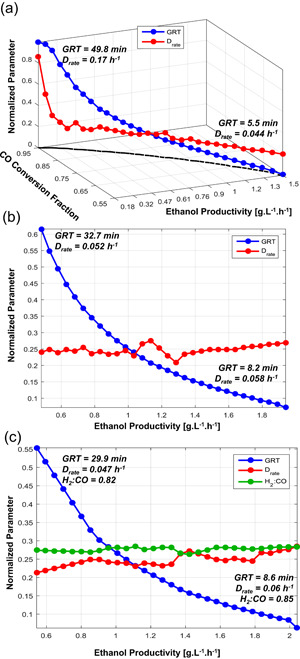
Figure 8.

Pareto‐optimal solutions for maximization of steady‐state ethanol productivity and CO conversion (a) Fixed gas composition at 65% CO, 20% H2, and 15% CO2 with normalized decision variables GRT and D rate plotted in the z‐axis; (b) fixed gas composition at 45% CO, 50% H2, and 5% CO2, all points correspond to 100% CO conversion; (c) H2:CO ratio free to vary between 0 and 3, all points correspond to 100% CO conversion. In all cases the decision variables are normalized with respect to their lower and upper bounds, that is, GRT between 5 and 50 min and D rate between 0.005 and 0.2 hr−1. The values of the most relevant decision variables at the solutions are shown in Tables S6–S8 [Color figure can be viewed at wileyonlinelibrary.com]
