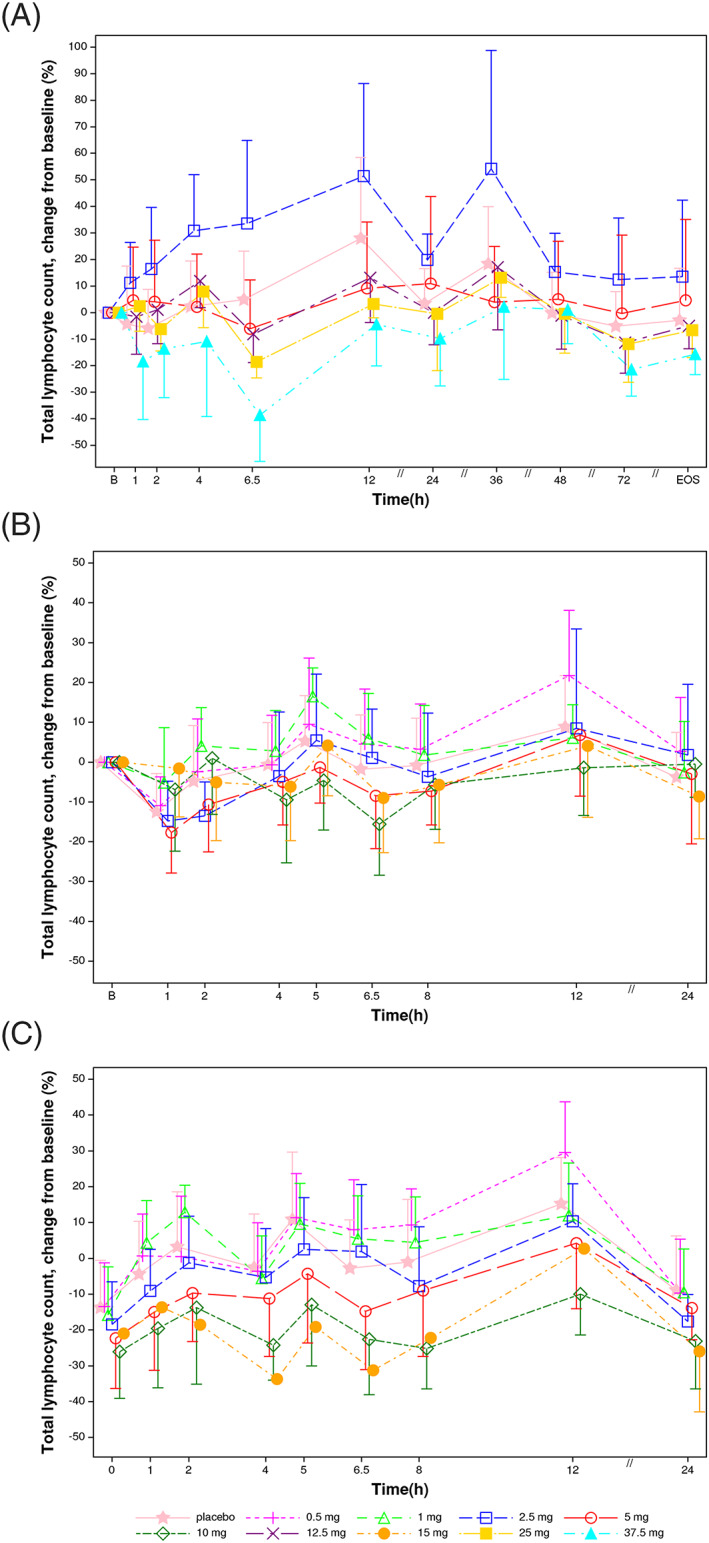
FIGURE 2.

Lymphocyte changes vs baseline following single and 14‐day oral administration of SAR247799 to healthy subjects. A, Day 1 of single ascending dose (n = 6 per dose, 10 placebo). B, Day 1 of multiple‐dosing study (n = 9 at 0.5 mg and 1 mg, n = 10 at 2.5 mg, n = 9 at 5 mg, 10 mg and 15 mg, and n = 18 on placebo). C, Day 14 of multiple‐dosing study (n = 9 at 0.5 mg and 1 mg, n = 10 at 2.5 mg, n = 9 at 5 mg and 10 mg, n = 1 at 15 mg, and n = 16 on placebo). Arithmetic mean and standard deviation
