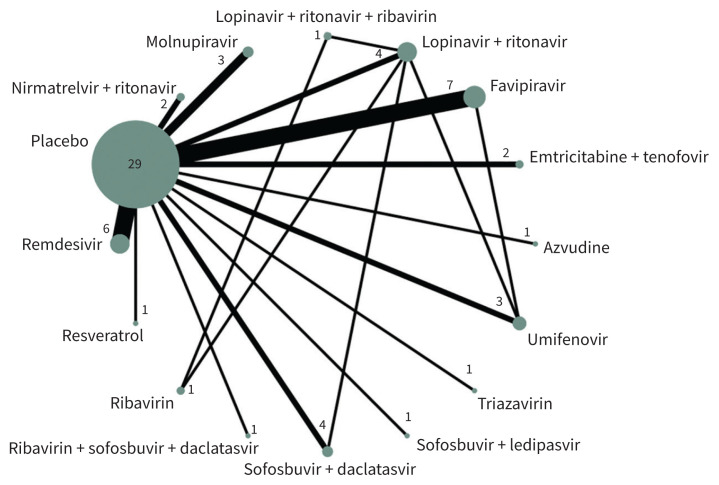
Figure 3:
Network diagram of antiviral drugs for COVID-19. Each sphere represents a drug or drug combination that has been tested in trials. The size of the sphere is proportional to the number of patients that have received that drug or drug combination, and the thickness of the connecting line is proportional to the number of trials.

