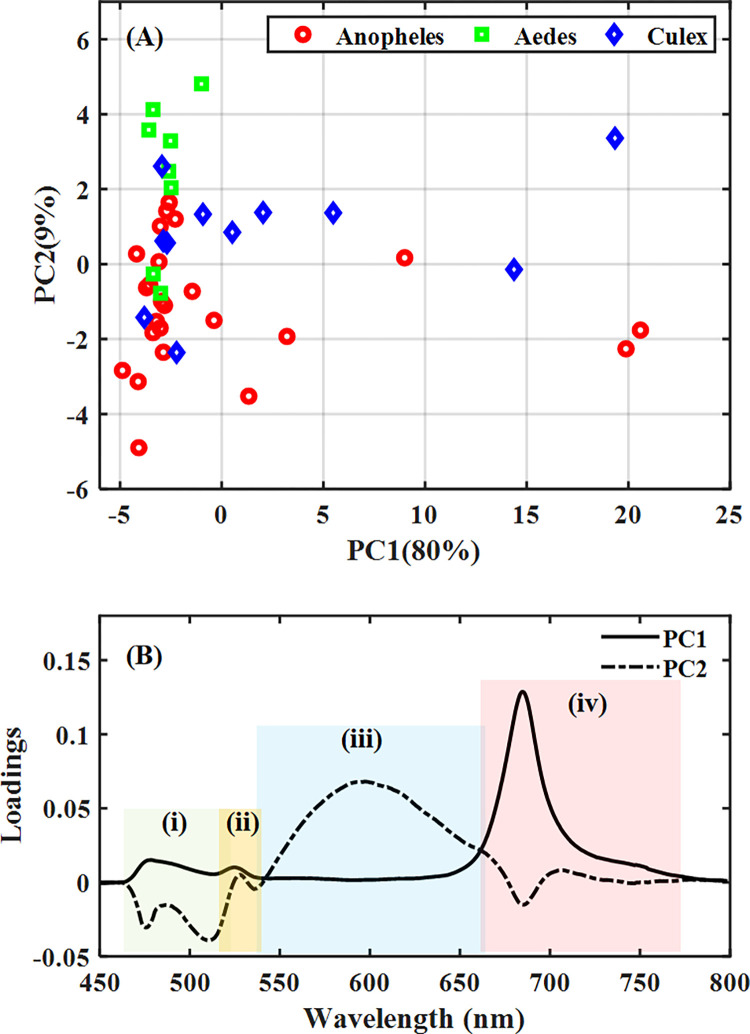
Fig 6.
PCA of LIF spectra of water samples from the various breeding sites with (A) Score plot showing distribution pattern among samples and (B) loading plot for PCs 1 and 2 showing specific regions (wavelengths) causing the distribution pattern in the score plot; (i) 460 nm– 515 nm, and (iii) 535 nm– 660 nm representing the DOM region, (ii) 515 nm– 535 nm representing the water Raman band and (iv) 660 nm– 780 nm representing the Chlorophyll region.

