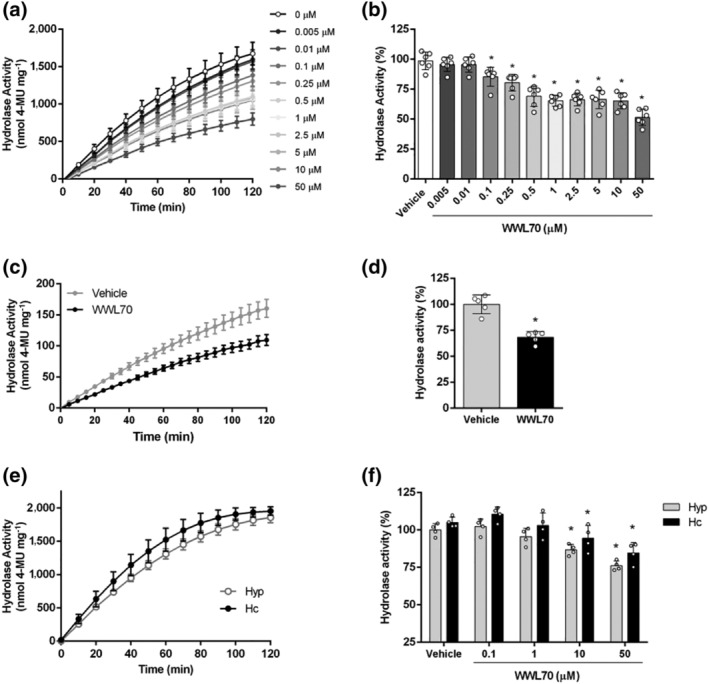
FIGURE 3.

ABHD6 activity assay based on 4‐MUH hydrolysis in cells endogenously expressing ABHD6 and in brain tissue homogenates. (a) ABHD6 activity inhibition by WWL70 (0.005–50 μM) in GT1‐7 mouse hypothalamic neuronal cell line; (b) at t = 120 min (n = 6). One‐way ANOVA followed by Bonferroni's post hoc correction was used for statistical analysis. (c) ABHD6 activity inhibition by WWL70 (1 μM) in cortical neurons of WT mice; (d) at t = 120 min (related to the WT vehicle) (n = 5). Student's t test was used for statistical analysis. (e) 4‐MUH hydrolysis in hypothalamus (Hyp) and hippocampus (Hc) of WT mice (n = 5). (f) ABHD6 activity inhibition by WWL70 (0.1–50 μM) in hypothalamus and hippocampus homogenates at t = 120 min (n = 5). Data shown are means ± SD. *P < 0.05, significantly different from vehicle; two‐way ANOVA followed by Bonferroni's post hoc correction
