FIGURE 6.

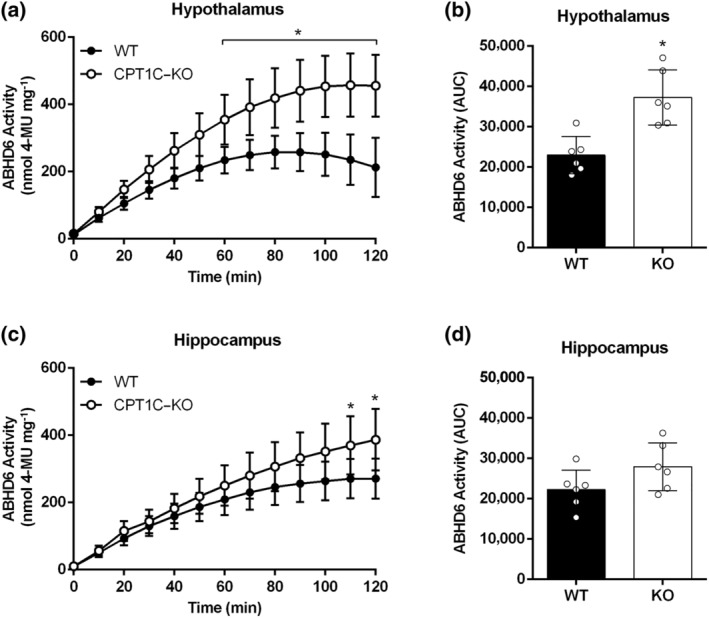
Brain tissues from CPT1C–KO mice compared to WT mice show increased ABHD6 activity. (a) ABHD6 activity in hypothalamic homogenates (n = 6) for CPT1C–KO compared to WT mice; (b) AUCs for hypothalamic activity. (c) ABHD6 activity in hippocampal homogenates (n = 6) for CPT1C–KO compared to WT mice; (d) AUCs for hippocampal activity. Data shown are means ± SD. *P < 0.05, significantly different from WT; Two‐way ANOVA followed by Bonferroni's post hoc correction
