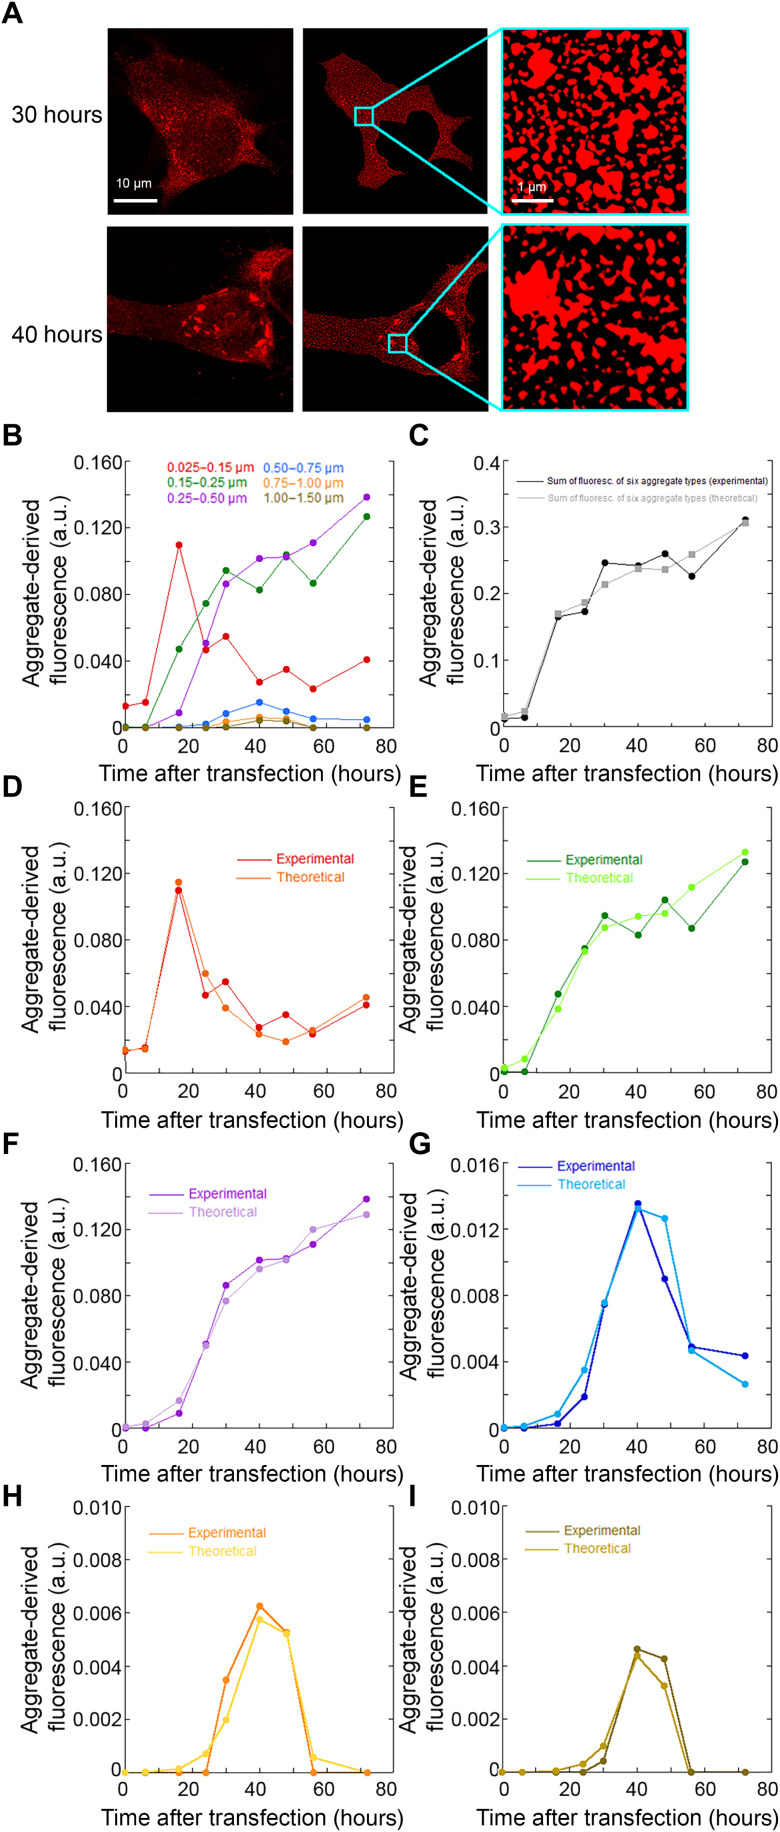
Fig. 3. Time courses of different size classes of TDP-43 inclusions.
(A) Approach used to identify size classes of TDP-43 inclusions: STED microscopy images of NSC-34 cells (n = 3) transfected with pCI-neo plasmid expressing human TDP-43 (left) were treated to exclude the nucleus area, after background subtraction, to obtain a better definition of the cytoplasmic inclusions (middle) and magnified to identify inclusions (right) and count them, as described in Materials and Methods. (B) Time courses of fluorescence density [F(t)/A] associated with each of the six size classes of cytoplasmic TDP-43 inclusions. (C) Experimental and theoretical time courses of total fluorescence density [F(t)/A] for the six aggregate types together. (D to I) Experimental and theoretical time courses of fluorescence density [F(t)/A] for the individual inclusion classes: diameters of 0.025 to 0.15 μm (D), 0.15 to 0.25 μm (E), 0.25 to 0.50 μm (F), 0.50 to 0.75 μm (G), 0.75 to 1.00 μm (H), and 1.00 to 1.50 μm (I). a.u., arbitrary units.

