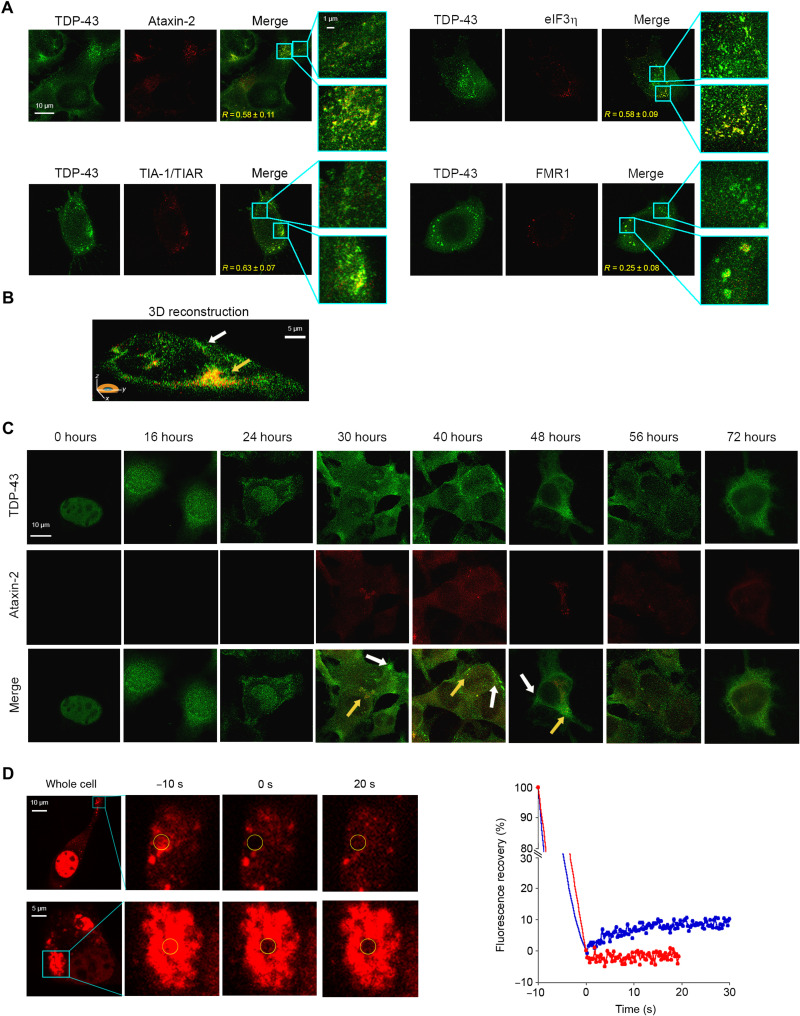
Fig. 6. TDP-43 is recruited to SGs, but the formation of TDP-43 inclusions is driven by different pathways.
(A) Representative STED microscopy images of NSC-34 cells (n = 3) transfected with 20 μg of pCI-neo plasmid expressing human TDP-43 and observed at 40 hours after transfection. The green and red fluorescence indicate total TDP-43 (endogenous and exogenous) and the indicated SG markers, respectively. The top and bottom magnification boxes indicate areas with TDP-43 assemblies with a low and high degree of colocalization with SG markers, respectively. R values are indicated in merge images. (B) 3D reconstruction of the z-stack analysis (5-μm-thick slices) of the specimens shown in (A). A cell was virtually dissected on the zy plane to show the intracellular TDP-43 inclusions (green) with (yellow arrow) and without (blank arrow) colocalization with the SG marker ataxin-2 (red). (C) Representative confocal scanning microscopy images of NSC-34 cells (n = 3) transfected with 20 μg of pCI-neo plasmid expressing total TDP-43 (endogenous and exogenous) and analyzed after different lengths of time after transfection. The green and red fluorescence indicate TDP-43 and ataxin-2, respectively. Yellow and white arrows indicate TDP-43 inclusions with or without colocalization with ataxin-2, respectively. (D) Representative images of two TDP-43 inclusions in NSC-34 cells (n = 3) transfected with 25 μg of wtTDP43tdTOMATOHA plasmid expressing tdTOMATO-labeled human TDP-43 and observed at 40 hours after transfection. The yellow circled regions of interest (ROIs) were photobleached starting at time −10 s for 10 s, and FRAP was then monitored continuously for 20 to 30 s starting at time 0 s. FRAP was plotted over time (blue and red curves correspond to top and bottom panels, respectively). Fluorescence values were normalized to the average intensity of each ROI before photobleaching (−10 s).

