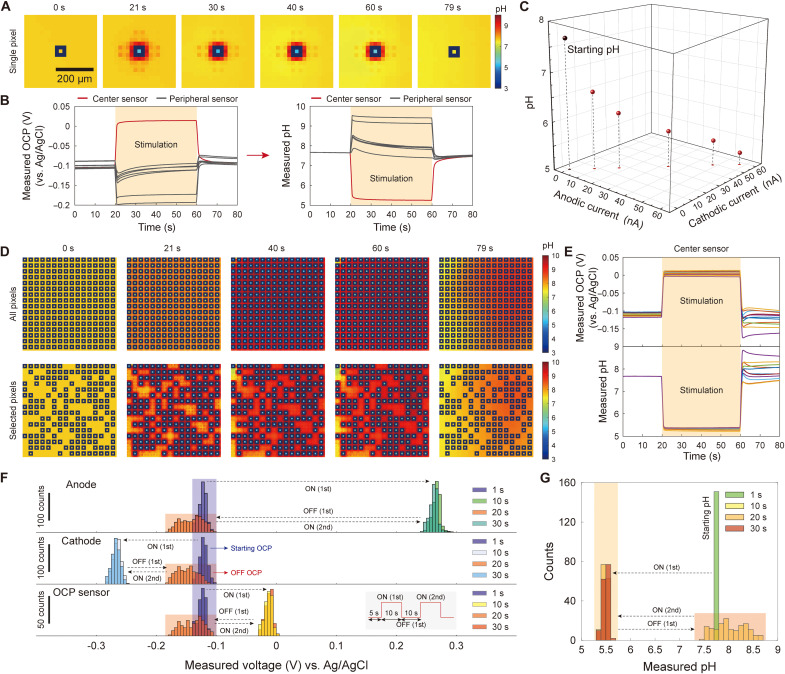
Fig. 3. Array-wide pH localization.
(A) pH localization at a single concentric pixel. (B) OCP and pH measured with the OCP sensor at the center of the pixel of part (A) (red line) and peripheral OCP sensors (gray lines). (C) By altering the magnitude of anodic and cathodic currents in optimal ratio 1:−1, the localized pH value can be tuned. (D) Array-wide pH localization for all 256 pixels (top) and selected pixels (bottom). (E) OCP and corresponding pH measured at centers of randomly sampled pixels in the experiment of (D), top. (F) Distributions of measured potentials at anodes, cathodes, and pixel center OCP sensors during application of two sets of anodic and cathodic current pulses at all 256 pixels. Bin size = 5 mV. The distribution of the measured potentials for each electrode type remains almost identical from the first pulse to the second pulse, indicating that concentration overpotentials do not develop during the stimulation. The absence of concentration overpotentials indicates that the redox species (i.e., quinones) are not depleted, enabling a repeatable pH control. (G) pH converted version of the bottom of (F), i.e., distribution of localized pH values measured at pixel center OCP sensors during the current pulse stimulation. Bin size = 0.1. The distribution of localized pH values remains almost identical from the first pulse to the second pulse. The ceiling height is about 39 μm throughout the figure.

