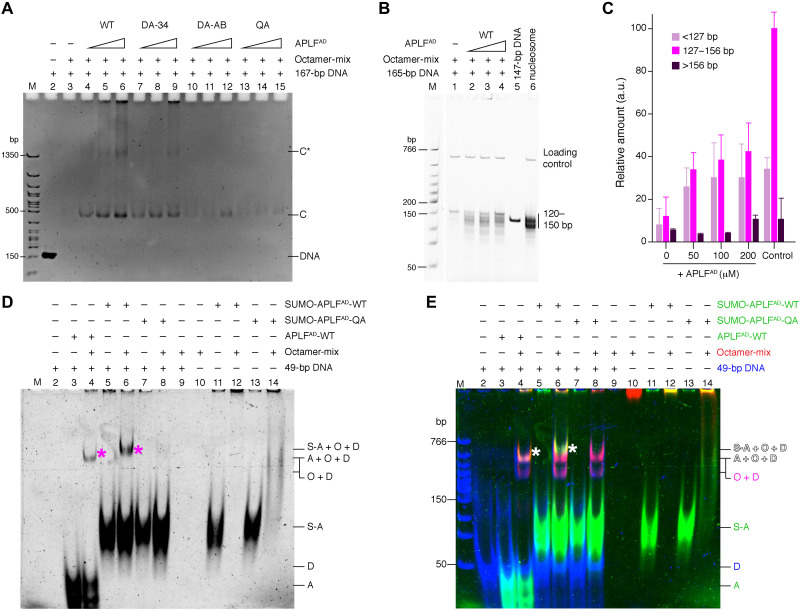
Fig. 6. APLFAD chaperones the histone octamer to promote nucleosome assembly.
(A) Native polyacrylamide gel electrophoresis (PAGE) analysis of precipitation-rescue assay showing formation of soluble protein-DNA complexes (bands “C” and “C*”) upon addition of increasing amounts of WT APLFAD to octamer-mix with DNA, which is strongly reduced for mutant APLFAD. Band C corresponds to the electrophoretic mobility of nucleosomes (fig. S13). Total DNA control is shown in lane 2. (B and C) NAQ results showing MNase digestion products obtained for octamer-mix with DNA and increasing amounts of APLFAD. Quantification of DNA digestion products [average and SEM (n = 3)] in (C). APLFAD increases the protected nucleosomal bands (127 to 156 bp) (P = 0.018, 0.018, and 0.016 for 50, 100, and 200 μM, respectively) according to one-tailed Student’s t test. Salt-assembled nucleosomes are used as control. (D and E) Native PAGE analysis of indicated mixtures of APLFAD, octamer-mix, and DNA, cross-linked with disuccinimidyl suberate. (D) Cy3-scan with APLFAD signal before DNA staining. (E) Merged image of the APLFAD (green), histone (red), and DNA (blue) scans (see fig. S14 for individual scans). APLFAD forms a ternary complex with histones and DNA (asterisk in lanes 4 and 6). SUMO-APLFAD was used as control to shift the ternary band above the background octamer-DNA complex. A = APLFAD, S-A = SUMO-APLFAD, O = histone octamer, D = DNA. Labels in (E) are color-coded according to the fluorescent dye.

