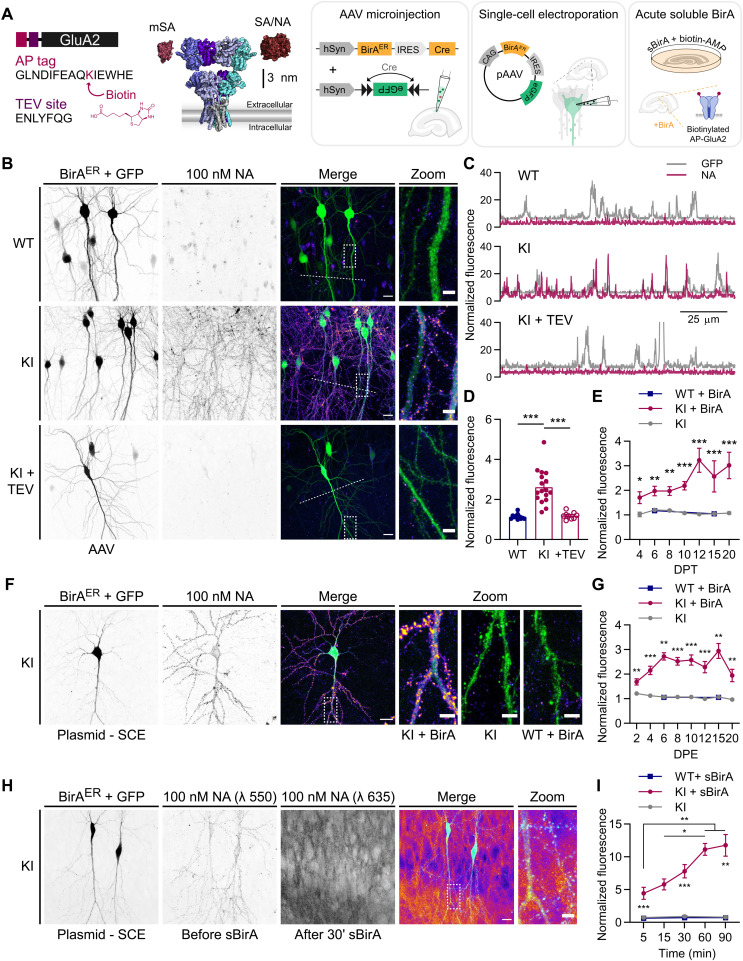
Fig. 1. Target-specific surface labeling of AMPAR by biotin binding proteins in an AP-GluA2 KI model.
(A) Schematic representation of the AP-GluA2 KI-modified extracellular N-terminal containing an AP tag and TEV protease consensus sequence, with a scaled model of AMPAR with monovalent (mSA) or tetravalent (SA and NA) biotin binding proteins (left) and molecular strategies to biotinylate AP-GluA2 (right). (B) Representative confocal images of CA1 pyramidal neurons in WT or AP-GluA2 KI slice cultures transduced with BirAER-Cre + FLEx eGFP AAV, incubated with NA–DyLight 633 to label surface bAP-GluA2 (top and middle) and TEV protease to cleave the AP tag and remove the NA surface label (bottom). (C) Line scans [dashed lines in (B)] reveal extent of NA colocalization with eGFP reporter. (D) Normalized fluorescence intensity of NA–DyLight 633, coincident with eGFP reporter. N ≥ 9. ***P ≤ 0.0001 [Welch’s analysis of variance (ANOVA), F = 23.99, P < 0.0001; Dunnett’s post hoc test]. (E) Time course of bAP-GluA2 expression in KI slices transduced with BirAER-Cre + FLEx eGFP AAV at 1 DIV, relative to WT (+BirA) or Cre control (−BirA). DPT, days post-transduction. N ≥ 3. *P ≤ 0.0201, **P ≤ 0.0089, and ***P ≤ 0.0009 (Mann-Whitney U test, unpaired t test, or Kruskal-Wallis test; F ≥ 12.44, P ≤ 0.002, Dunn’s post hoc test). (F) CA1 pyramidal neurons in AP-GluA2 KI or WT slices electroporated with BirAER-eGFP or eGFP control plasmids at 3 DIV. (G) Time course of bAP-GluA2 expression in KI slices electroporated with BirAER-eGFP, relative to WT (+BirA) or eGFP control (−BirA). DPE, days post-electroporation. N ≥ 5. **P ≤ 0.0098 and ***P ≤ 0.0005 (Mann-Whitney U test, unpaired t test, Kruskal-Wallis test, or Welch’s ANOVA; F ≥ 16.22, P ≤ 0.0006, Dunn’s or Dunnett’s post hoc test). (H) Two-color labeling of BirAER-eGFP electroporated KI slices, first with NA–DyLight 550 and then with NA-STAR 635P after 30-min incubation with sBirA, which rapidly biotinylates surface AP-GluA2. (I) Time course of bAP-GluA2 expression in sBirA-incubated KI slices, relative to WT or biotin-AMP control. N ≥ 5. *P ≤ 0.042, **P ≤ 0.0051, and ***P ≤ 0.0007 (Kruskal-Wallis test or Welch’s ANOVA; F ≥ 14.69, P ≤ 0.0003, Dunn’s or Dunnett’s post hoc test). Scale bars, 20 and 5 μm. Error bars, SEM. See also figs. S1 to S8.

