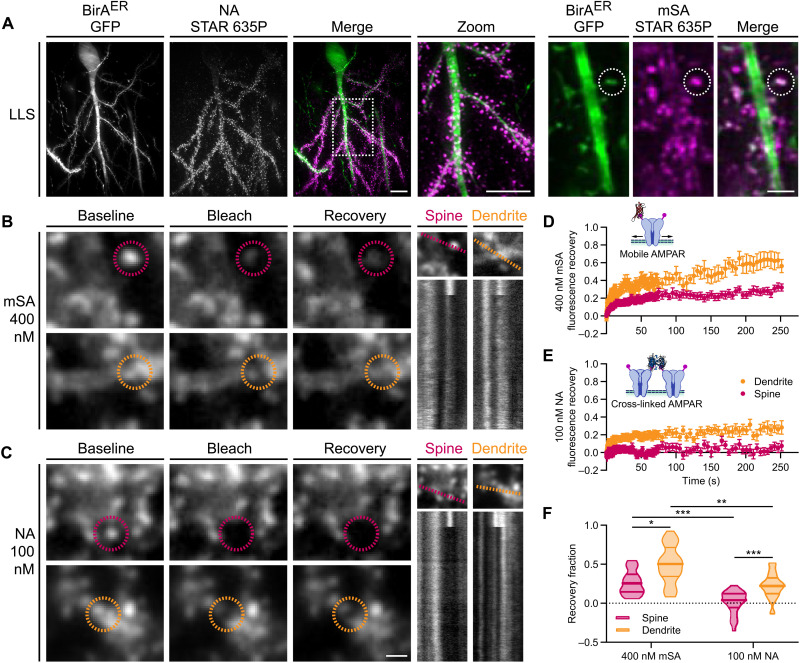
Fig. 2. LLSM-FRAP with biotin binding proteins reveals surface mobility and immobilization of AP-GluA2–containing AMPAR.
(A) Representative three-dimensional (3D) reconstructed LLSM images of CA1 pyramidal neurons in AP-GluA2 KI slice cultures transduced with BirAER-Cre + FLEx eGFP or BirAER-eGFP AAV, incubated with NA (left) or mSA (right) to label surface bAP-GluA2. Scale bars, 10 and 2 μm. (B and C) FRAP experiments performed on a custom LLSM with PSM in AP-GluA2 KI slices labeled with mSA-STAR 635P (B) or NA-STAR 635P (C). Representative images show spine or dendrite ROIs (dashed circles) before (baseline; −1 s) and after targeted photobleaching (bleach; +0.5 s) and diffusion-dependent recovery (recovery; +70 s). Scale bar, 1 μm. Kymographs illustrate fluorescence recovery profiles of the targeted ROIs during the acquisition (dashed line; ~250 s). (D and E) Normalized mean fluorescence recovery curves for bAP-GluA2 labeled with monovalent mSA reveal synaptic and extrasynaptic mobility of endogenous AMPAR (D) or tetravalent NA, which immobilizes surface AMPAR by cross-linking of bAP-GluA2 (E). N ≥ 25. In total, 52 to 88% of FRAP ROIs were maintained in the LLSM excitation plane and followed for the full length of the acquisition. Error bars, SEM. (F) Quantification of the AMPAR mobile fraction by curve fitting of individual FRAP recovery profiles; plot shows median with first and third quartiles. N ≥ 25. *P ≤ 0.0333, **P ≤ 0.0026, and ***P ≤ 0.0005 (Kruskal-Wallis test; F = 53.60, P < 0.0001; Dunn’s post hoc test). See also figs. S9 to S12.

