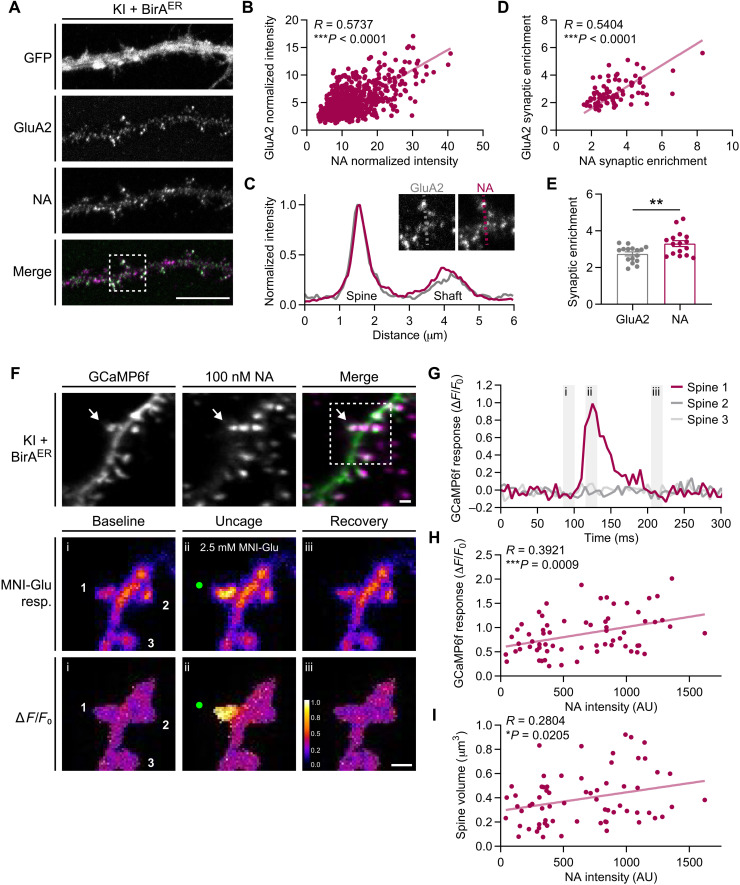
Fig. 3. Avidin detection of bAP-GluA2 correlates with GluA2 density and synapse function.
(A) Representative confocal images of hippocampal neuron cultures from AP-GluA2 KI mice transduced with BirAER-eGFP AAV, live-labeled with NA–DyLight 633 and α-GluA2. Scale bar, 10 μm. (B) Correlation of GluA2 versus NA intensity at synaptic spines. N = 671 spines, 16 cells. ***P < 0.0001 (Pearson correlation; R = 0.5737). (C) Representative line scans across synaptic and dendritic ROIs (inserts) used to calculate the synaptic enrichment factor. (D) Correlation of GluA2 versus NA synaptic enrichment. N = 80 spines, 16 cells. ***P < 0.0001 (Pearson correlation; R = 0.5404). (E) Mean synaptic enrichment of GluA2 and NA. N = 16. **P = 0.0069 (unpaired t test). Error bars, SEM. (F) Representative 3D reconstructed LLSM images from CA1 pyramidal neuron dendrites in AP-GluA2 KI slice cultures transduced with BirAER-Cre + FLEx GCaMP6f, incubated with NA-STAR 635P to label surface-localized bAP-GluA2 (top). Representative images of synaptic Ca2+ responses induced by two-photon glutamate uncaging (green dots, focal point for MNI-glutamate photolysis; middle, raw images of GCaMP6f intensity; bottom, ΔF/F0 averaged projection). Scale bars, 1 μm. (G) Plot profile of ΔF/F0 projection of GCaMP6f intensity at synaptic spines, as indicated in (F). Gray bars (i to iii) correspond to baseline (i), uncage (ii), and recovery (iii) time points, as indicated in (F). (H) Correlation of GCaMP6f glutamate uncaging synaptic response versus NA intensity over the spine surface. N = 68. ***P = 0.0009 (Pearson correlation; R = 0.3921). (I) Correlation of spine volume versus NA intensity over the spine surface. N = 68. *P = 0.0205 (Pearson correlation, R = 0.2804).

