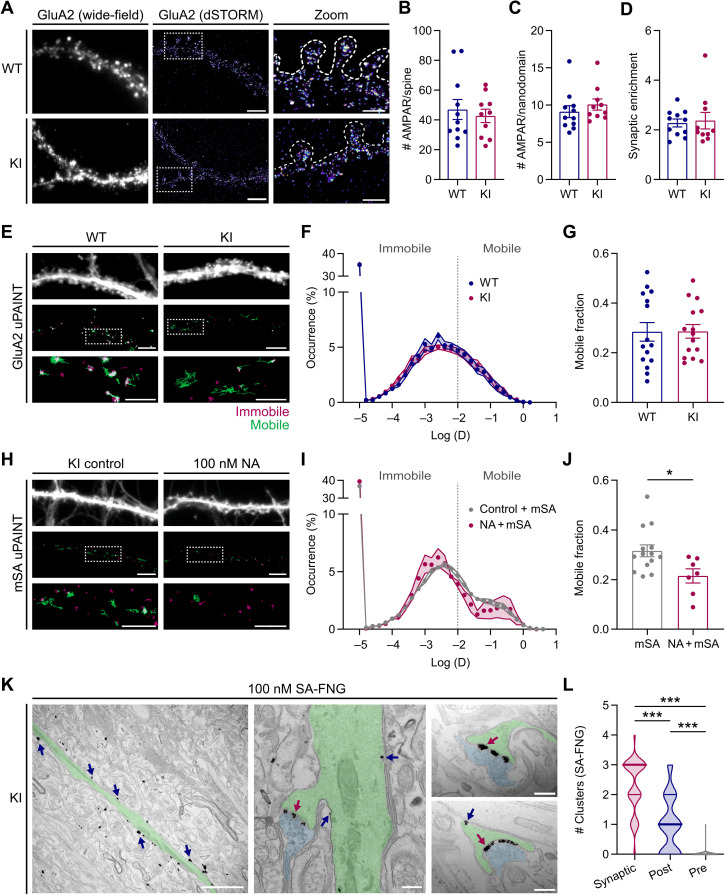
Fig. 4. Superresolution and TEM imaging approaches with AP-GluA2.
(A) Representative wide-field and superresolved dSTORM images of cultured WT and KI hippocampal neurons, live-labeled with α-GluA2. Scale bars, 5 and 2.5 μm. (B to D) Number of AMPARs on individual spines (B), in synaptic nanodomains (C), and AMPAR synaptic enrichment factor (D), estimated by counting the single emitters. Plots show the median per cell. N ≥ 10. P ≥ 0.1971 (Mann-Whitney U tests). (E) Representative wide-field and reconstructed uPAINT trajectory images of WT and KI neurons transduced with eGFP AAV and live-labeled with α-GluA2–SeTau 647 [mobile GluA2 trajectories in green and immobile GluA2 trajectories in red (log(D) ≥ or ≤ −2, respectively)]. (F and G). Average distribution of the logarithm of diffusion (F) and ratio of mobile over immobile fraction (G). N = 15. P = 0.9675 (unpaired t test). (H) Representative images of KI neurons transduced with BirAER-eGFP AAV, incubated with vehicle control or 100 nM unconjugated NA. mSA-STAR 635P (7.8 nM) was used to record uPAINT trajectories of bAP-GluA2. Scale bars, 5 and 2.5 μm. (I and J). Average distribution and ratio, as in (F) and (G). N ≥ 7. *P = 0.0193 (unpaired t test). Error bars, SEM. (K) Representative TEM images of bAP-GluA2 in CA1 pyramidal neurons from AP-GluA2 KI slice cultures transduced with BirAER-eGFP AAV and incubated with 100 nM SA conjugated to FluoroNanogold (SA-FNG) and then processed with silver enhancement for visualization. Left: An apical dendrite (shaded green) with multiple SA-FNG clusters (arrows). Middle: A dendritic spine and presynaptic bouton (shaded blue), with synaptic (red arrow) and extrasynaptic SA-FNG clusters (blue arrows). Right: Representative images used to quantify SA-FNG cluster localization to synaptic cleft (red arrow), postsynaptic spine (blue arrow), or presynaptic bouton (not shown/infrequently detected). Scale bars, 2 μm and 200 nm. (L) Subcellular distribution of SA-FNG clusters; plot shows the median with first and third quartiles. N = 39 synapses, three experiments. ***P < 0.0001 (Kruskal-Wallis test; F = 74.88, P < 0.0001; Dunn’s post hoc test). See also fig. S13.

