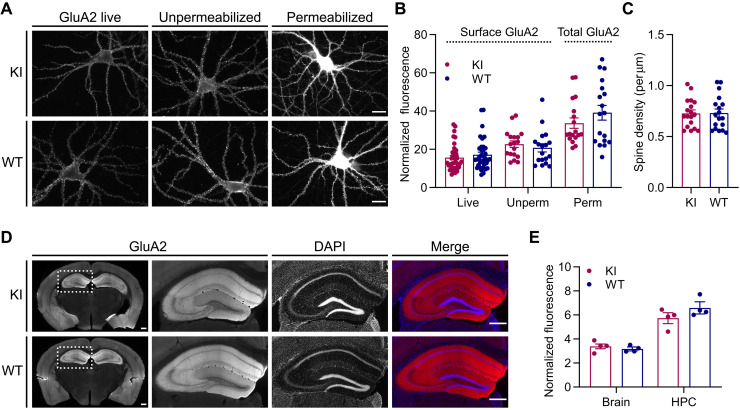
Fig. 6. Immunological characterization of AP-GluA2 expression and localization.
(A) Representative wide-field images of KI and WT hippocampal neurons in primary dissociated culture labeled with α-GluA2 live (left), after fixation (middle), or after fixation and permeabilization (right). Scale bars, 20 μm. (B). Normalized fluorescence intensity of surface or whole-cell GluA2. N ≥ 18. P ≥ 0.2649 (Mann-Whitney U tests). (C) Spine density in KI and WT hippocampal neuron cultures. N = 18. P = 0.9484 (unpaired t test). (D) Representative tiled wide-field images of 50-μm frontal sections from KI or WT brains labeled with α-GluA2. Scale bars, 500 μm. (E) Fluorescence intensity of GluA2 in KI or WT sections, normalized to secondary-only control. N = 4. P ≥ 0.1682 (unpaired t tests). Error bars, SEM. See also fig. S18.

