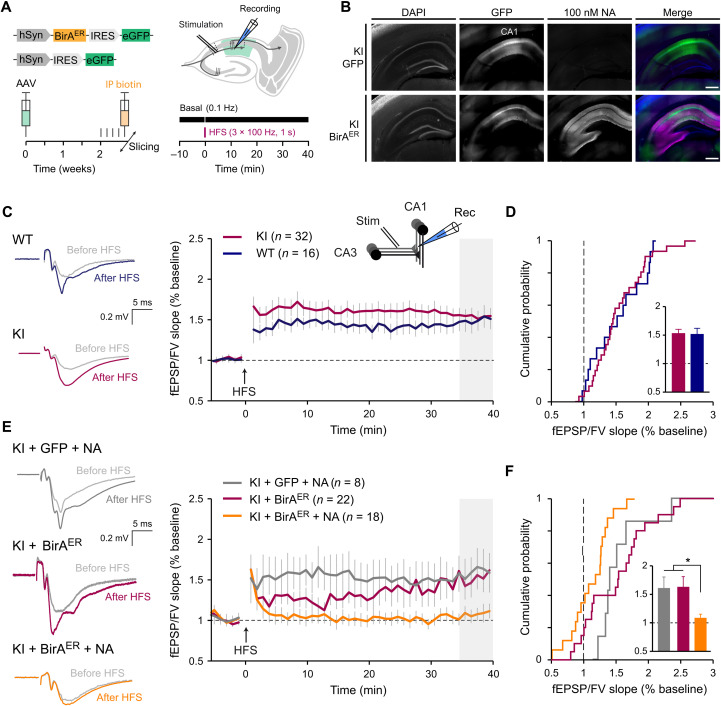
Fig. 8. AMPAR immobilization by NA cross-linking precludes LTP.
(A) Overview of the experimental preparation, AAV stereotaxic injection in the dorsal hippocampus followed by intraperitoneal biotin injection (left), and field recordings of LTP in CA1 evoked by HFS (3 × 1-s trains, 100 Hz) of Schaffer collaterals in acute slices (right). (B) Representative tiled wide-field images of 300-μm frontal brain sections from KI mice injected with eGFP control or BirAER-eGFP AAV, live-labeled with 100 nM NA conjugated to DyLight 633. Scale bars, 500 μm. (C and D) HFS-induced LTP in acute slices from KI and WT mice (KI in red; WT in blue), representative voltage traces and summary time courses (C), and cumulative histograms (D) of mean normalized fEPSP/FV slope 35 to 40 min after HFS induction (shaded gray). N ≥ 16. P = 0.8580 (unpaired t test). Statistical comparison of LTP was 35 to 40 min after HFS. Number of slices is indicated in brackets. (E and F) HFS-induced LTP in acute slices from KI mice injected in CA1 with eGFP control or BirAER-eGFP AAV (eGFP + NA in gray, BirAER without NA in red, and BirAER + NA in orange); slices were incubated with 100 nM NA and then continuously perfused with 10 pM NA, as in (C) and (D). N ≥ 8. *P ≤ 0.0365 (Kruskal-Wallis test; F = 8.812, P = 0.0122; Dunn’s post hoc test). Error bars, SEM. See also fig. S20 for basal transmission controls.

