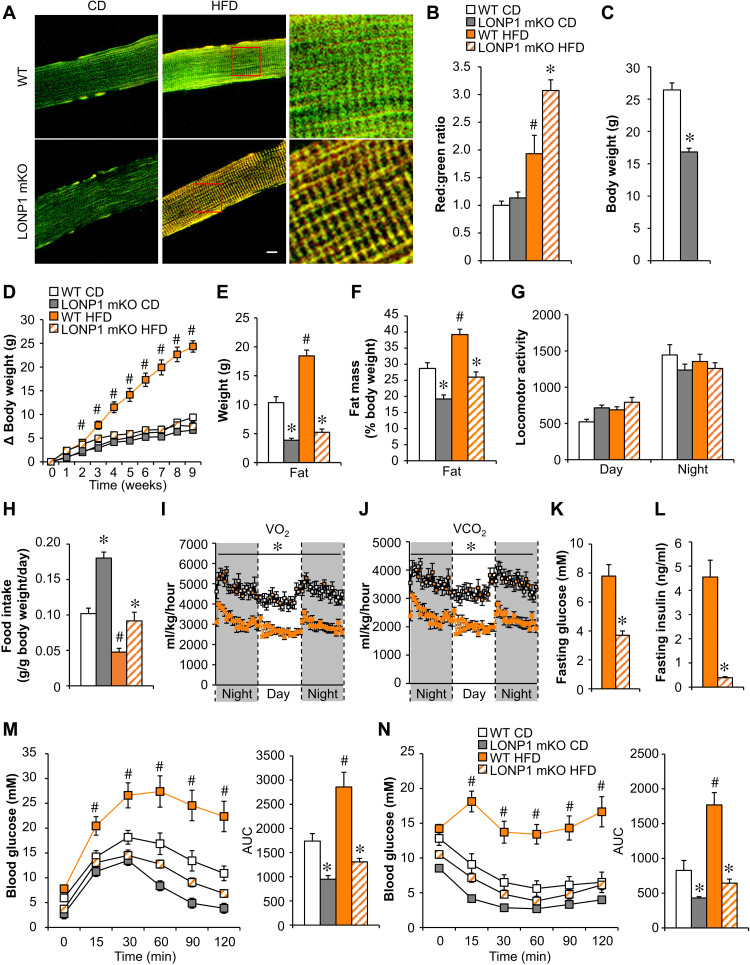
Fig. 1. Skeletal muscle–specific deletion of LONP1 confers resistance to diet-induced obesity and improves insulin sensitivity.
(A) Confocal images of soleus muscle fibers from LONP1 mKO/MitoTimer and Lonp1f/f/MitoTimer mice following chow diet (CD) or HFD feeding. Scale bar, 10 μm. (B) Quantification of MitoTimer red:green ratio normalized (= 1.0) is shown. n = 3 to 6. (C) Body weight at the age of 6 weeks. n = 9 to 13. (D) Increase in body weight following HFD feeding. n = 8 to 13. (E) Body composition measured to determine fat mass. n = 8 to 10. (F) Fat mass plotted as a percentage of body weight. (G) Locomotor activity. n = 7 to 8. (H) Food consumption. n = 7 to 8. Data are expressed as gram consumed per gram of body weight per day. (I and J) Oxygen consumption and carbon dioxide production normalized to body weight. n = 8. (K and L) Fasting glucose and insulin levels. n = 8 to 10. (M and N) Left: Glucose and insulin tolerance test (GTT and ITT). Right: Area under the curve for GTT or ITT is shown. n = 8 to 10. Color legend for the panel: white, WT CD; gray, LONP1 mKO CD; orange, WT HFD; diagonal hatch, LONP1 mKO HFD. Values represent means ± SEM. *P < 0.05 versus corresponding WT controls; #P < 0.05 versus corresponding CD controls. Two-tailed unpaired Student’s t test (C and I to L) or one-way analysis of variance (ANOVA) (B, D to H, M, and N) was performed.

