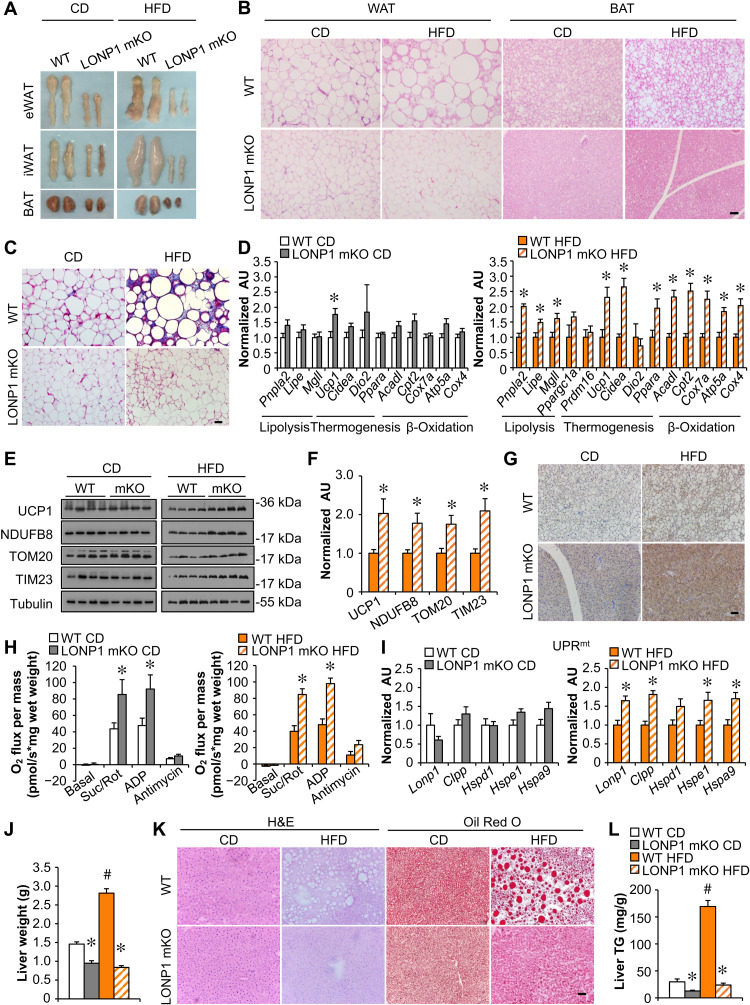
Fig. 2. Muscle LONP1 regulates the response of adipose tissue and liver to HFD.
(A) Pictures of adipose pads from indicated mice fed CD or HFD. (B) Hematoxylin and eosin (H&E) staining of epididymal WAT (eWAT) and BAT. Scale bar, 50 μm. n = 5 to 9. (C) Masson’s trichrome staining in eWAT. Scale bar, 50 μm. n = 5 to 9. (D) Expression of genes [quantitative reverse transcription polymerase chain reaction (qRT-PCR)] in BAT from indicated mice fed CD or HFD. n = 6. (E) Western blot analysis of BAT from indicated mice. n = 4. (F) Quantification of UCP1/tubulin, NDUFB8/tubulin, TOM20/tubulin, and TIM23/tubulin in BAT from indicated mice fed HFD. n = 4. (G) UCP1 immunohistochemistry (IHC) staining in BAT from indicated mice fed CD or HFD. Scale bar, 50 μm. n = 4 to 5. (H) Mitochondrial respiration rates were determined from BAT of indicated genotypes. Succinate/rotenone (Suc/Rot)–stimulated, adenosine 5′-diphosphate (ADP)–dependent, and antimycin-induced respiration is shown. n = 5 to 8. (I) Expression of genes involved in UPRmt in BAT from indicated mice fed CD or HFD. n = 6. (J) Liver weight. n = 8 to 10. (K) H&E and Oil Red O staining of livers. Scale bar, 50 μm. n = 5 to 6. (L) Liver triglyceride levels. n = 6 to 8. Color legend for the panel: white, WT CD; gray, LONP1 mKO CD; orange, WT HFD; diagonal hatch, LONP1 mKO HFD. Values represent means ± SEM. *P < 0.05 versus corresponding WT controls; #P < 0.05 versus corresponding CD controls. Two-tailed unpaired Student’s t test (D, F, H, and I) or one-way ANOVA (J and L) was performed. AU, arbitrary units.

