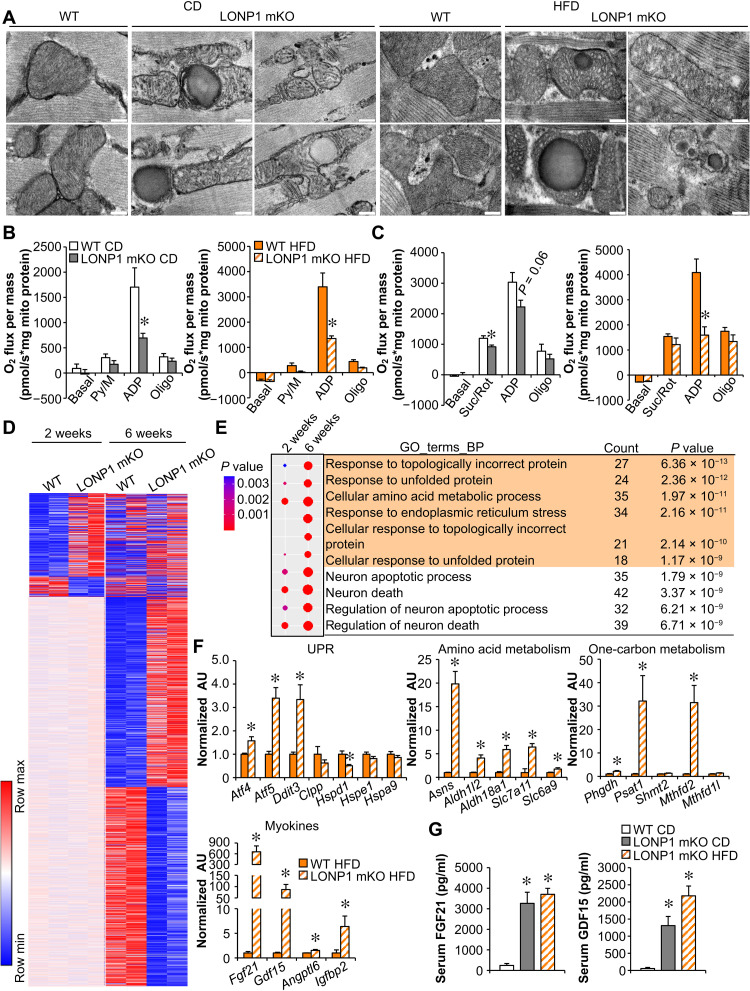
Fig. 3. Loss of LONP1 elicits the mitochondrial UPR in skeletal muscle.
(A) Electron micrographs of soleus muscle showing intermyofibrillar mitochondria in sections from indicated mice fed CD or HFD. Scale bars, 200 nm. n = 3 to 4. (B and C) Mitochondrial respiration rates were determined on mitochondria isolated from muscles of indicated mice using pyruvate (B) or succinate (C) as substrates. Pyruvate/malate (Py/M)- or Suc/Rot-stimulated respiration is shown. n = 3 to 7. (D) Heatmap analysis of genes differentially regulated in LONP1 mKO muscles. Each group is represented by RNA sequencing (RNA-seq) data from two independent samples generated from muscles of 2- and 6-week-old mice. Red, relative increase in abundance; blue, relative decrease. (E) Gene Ontology (GO) enrichment analysis of genes that were induced early at 2 weeks old and were further enhanced by LONP1 abrogation at 6 weeks old, with top 10 terms shown. The dot size reflects the gene count. (F) Expression of genes (qRT-PCR) related to UPR, amino acid metabolism, one-carbon metabolism, and myokines in muscles from HFD-fed LONP1 mKO mice. n = 6. (G) Serum FGF21 and GDF15 levels. n = 6 to 9. Color legend for the panel: white, WT CD; gray, LONP1 mKO CD; orange, WT HFD; diagonal hatch, LONP1 mKO HFD. Values represent means ± SEM. *P < 0.05 versus corresponding WT controls. Two-tailed unpaired Student’s t test (B, C, and F) or one-way ANOVA (G) was performed.

