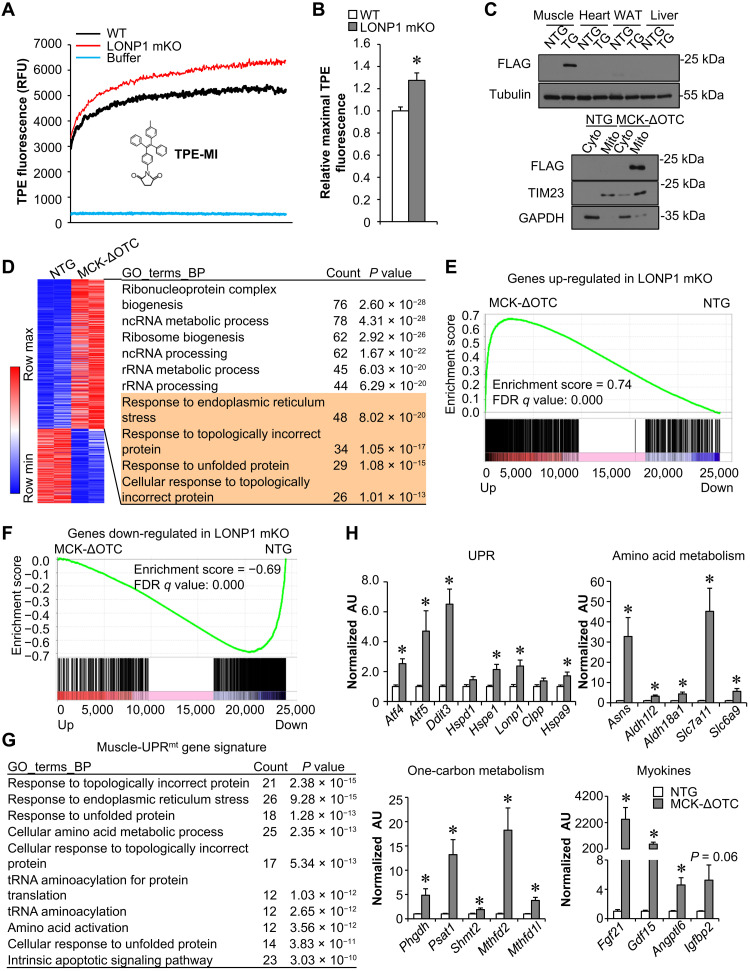
Fig. 4. Mitochondria overloaded by unfolded proteins beyond the LONP1 capacity induce the UPRmt in skeletal muscle.
(A) Mitochondria were isolated from indicated mice and incubated with TPE-MI dye, followed by measurement of fluorescence intensity for 2 hours. n = 6 to 8. (B) Quantification of the maximal fluorescence ratios normalized (= 1.0) to WT controls. n = 6 to 8. (C) Top: Western blot analysis of ΔOTC expression in tissues from indicated mice. Bottom: Western blot analysis performed with mitochondrial and cytosolic fractions isolated from muscles of the indicated mice. (D) Left: Heatmap of differentially expressed genes. RNA-seq data (n = 2 independent) were generated from muscles of 2-week-old indicated mice. Red, relative increase in abundance; blue, relative decrease. Right: GO enrichment analysis of gene transcripts up-regulated in MCK-ΔOTC muscles, with top 10 terms shown. (E and F) GSEA of genes regulated in LONP1-deficient muscles in relation to genes altered in MCK-ΔOTC muscles. Genes regulated by ΔOTC overexpression were ranked by fold difference and expressed on the x axis. This dataset was compared with regulated genes identified in LONP1 mKO muscles. (G) GO enrichment analysis of the muscle-UPRmt gene signature, the core set of genes commonly up-regulated by both ΔOTC overexpression and LONP1 mKO in muscle, with top 10 terms shown. (H) Expression of genes (qRT-PCR) related to UPR, amino acid metabolism, one-carbon metabolism, and myokines in muscles from indicated mice. n = 6. Values represent means ± SEM. *P < 0.05 versus corresponding nontransgenic (NTG) controls. Two-tailed unpaired Student’s t tests were performed.

