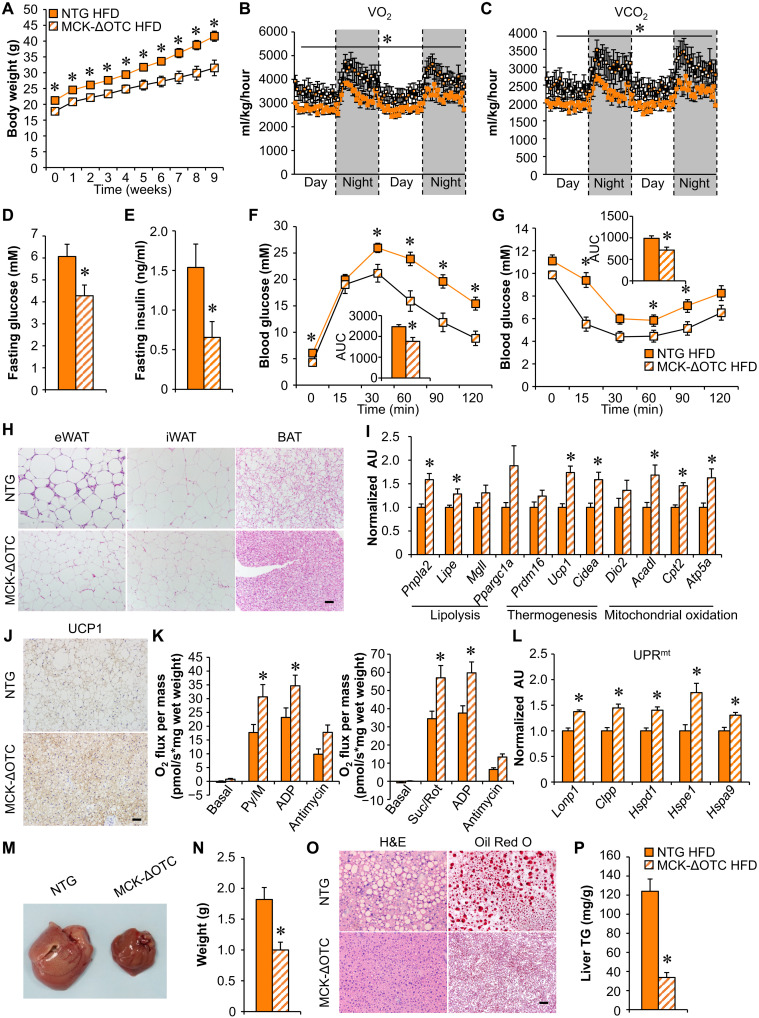
Fig. 5. Mitochondrial proteostasis stress in skeletal muscle protects against HFD-induced obesity and improves glucose homeostasis.
(A) Growth curves following HFD feeding. n = 12 to 14. (B and C) Oxygen consumption and carbon dioxide production normalized to body weight. n = 7 to 8. (D and E) Fasting glucose and insulin levels. n = 12 to 14. (F and G) GTT and ITT. Inset: Area under the curve for GTT or ITT is shown. n = 12 to 14. (H) H&E staining of eWAT, inguinal WAT (iWAT), and BAT of indicated mice following HFD feeding. Scale bar, 50 μm. n = 7 to 9. (I) Expression of genes (qRT-PCR) in BAT from indicated mice. n = 6. (J) UCP1 IHC staining in BAT. Scale bar, 50 μm. n = 4 to 5. (K) Mitochondrial respiration rates were determined from the BAT of indicated genotypes using pyruvate or succinate as substrates. n = 9 to 11. (L) Expression of genes (qRT-PCR) involved in UPRmt in BAT from indicated mice. n = 6. (M) Pictures of livers from the indicated mice fed HFD. (N) Liver weight. n = 12. (O) H&E and Oil Red O staining of livers. Scale bar, 50 μm. n = 6. (P) Liver triglyceride levels. n = 6 to 9. Color legend for the panel: orange, NTG HFD; diagonal hatch, MCK-ΔOTC HFD. Values represent means ± SEM. *P < 0.05 versus corresponding NTG controls. Two-tailed unpaired Student’s t tests were performed.

