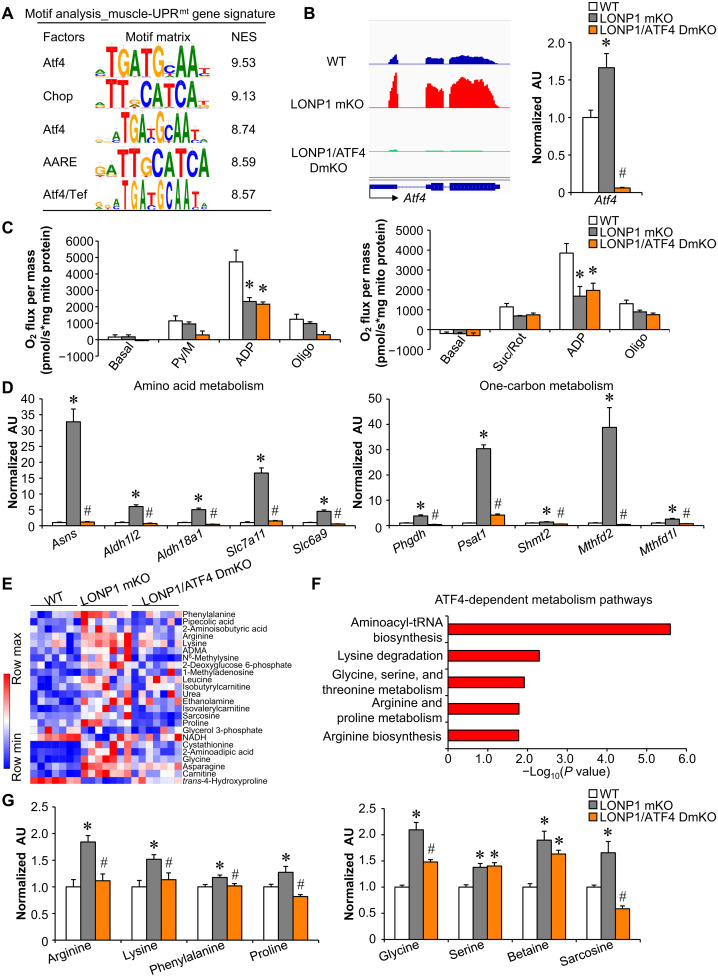
Fig. 6. Mitochondrial proteostasis stress programs local amino acid and one-carbon metabolism in skeletal muscle via the ATF4 transcription factor.
(A) Motif enrichment analysis of the muscle-UPRmt gene signature using i-CisTarget. The table includes the transcription factor gene symbols, consensus binding sites, and their normalized enrichment scores (NES). (B) Left: Genome browser tracks of RNA-seq data were visualized in Integrative Genomics Viewer. Right: Expression of the Atf4 (qRT-PCR) in GC muscle from indicated genotypes. n = 6. (C) Mitochondrial respiration rates were determined on mitochondria isolated from muscles of the indicated mice using pyruvate or succinate as substrates. n = 3 to 5. (D) Expression of genes (qRT-PCR) involved in amino acid and one-carbon metabolism in GC muscles from indicated mice. n = 6. (E) Heatmap analysis of muscle metabolites. Capillary electrophoresis–mass spectrometry–based metabolite analysis was performed with GC muscles from indicated mice. n = 7. Red, relative increase in abundance; blue, relative decrease. ADMA, asymmetric dimethylarginine; NADH, reduced form of nicotinamide adenine dinucleotide. (F) Pathway analysis of ATF4-dependent metabolites using online software MetaboAnalyst 5.0. (G) Amino acid levels in WT, LONP1 mKO, and LONP1/ATF4 DmKO muscles. n = 7. Color legend for the panel: white, WT; gray, LONP1 mKO; orange, LONP1/ATF4 DmKO. Values represent means ± SEM. *P < 0.05 versus WT controls; #P < 0.05 versus LONP1 mKO. One-way ANOVA tests were performed.

