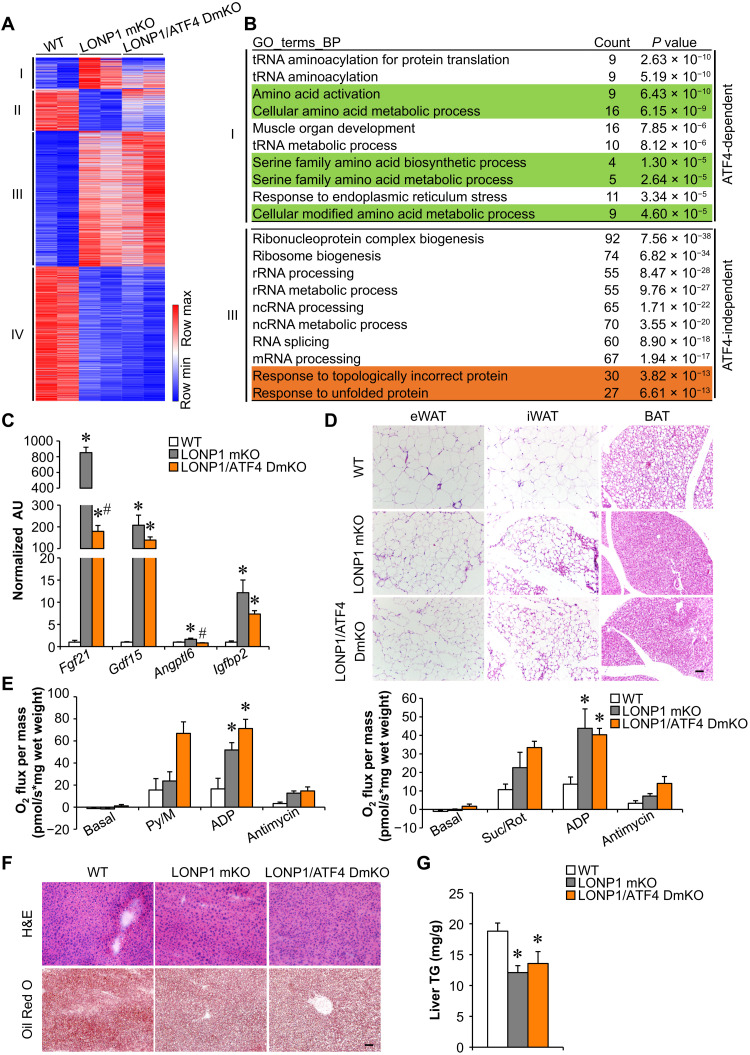
Fig. 7. Mitochondrial proteostasis stress directs a long-range metabolic response independent of ATF4 in skeletal muscle.
(A) Heatmap analysis of genes differentially regulated in muscles from indicated mice. Each group is represented by RNA-seq data from two independent samples generated from muscles from indicated mice. The differentially regulated genes were clustered into four groups, and a color scheme for fold change is provided. Red, relative increase in abundance; blue, relative decrease. (B) GO enrichment analysis of clusters I (ATF4-dependent) and III (ATF4-independent) genes, with top 10 terms shown. (C) Expression of myokines genes (qRT-PCR) in GC muscles from the indicated mice. n = 6. (D) H&E staining of eWAT, iWAT, and BAT of indicated mice. Scale bar, 50 μm. n = 4 to 8. (E) Mitochondrial respiration rates were determined from the BAT of indicated genotypes using pyruvate or succinate as substrates. n = 4 to 10. (F) H&E and Oil Red O staining of livers from indicated mice. Scale bar, 50 μm. n = 4 to 6. (G) Liver triglyceride levels from indicated mice. n = 5 to 7. Color legend for the panel: white, WT; gray, LONP1 mKO; orange, LONP1/ATF4 DmKO. Values represent means ± SEM. *P < 0.05 versus WT controls; #P < 0.05 versus LONP1 mKO. One-way ANOVA tests were performed.

