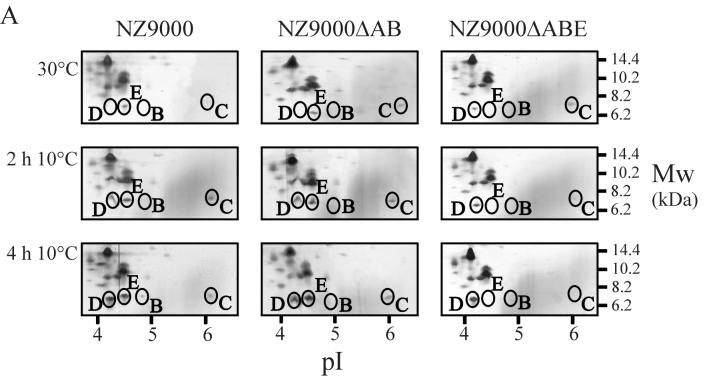
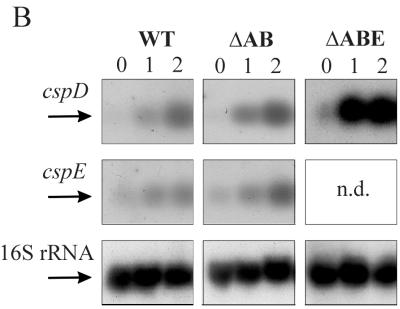
FIG. 2.
CSP production and cspD and cspE mRNA levels at different time points after cold shock in strains NZ9000 (wild type), NZ9000ΔAB, and NZ9000ΔABE. (A) Proteins were extracted at mid-exponential phase (30°) and at 2 and 4 h after cold shock to 10°C. Only fragments of the 2D-E gels containing the region with the CSPs of L. lactis are shown, as was determined previously (35, 36). Equal amounts of the cell extracts were separated on a pI range of 3 to 10, and the proteins were visualized using silver staining. Molecular size markers are indicated on the right, and a pI scale is given at the bottom. CspA levels are not depicted on these gels and can be seen in Fig. 3. (B) mRNA levels of cspD, cspE, and 16S rRNA in strains NZ9000, NZ9000ΔAB, and NZ9000ΔABE. Northern blots of RNA extracted at 0, 1, and 2 h after cold shock from 30 to 10°C of strains NZ9000 (left), NZ9000ΔAB (center), and NZ9000ΔABE (right) are shown. Transcript sizes are about 300 nt for all csp genes and approximately 1,500 nt for 16S rRNA. N.d., not determined.


