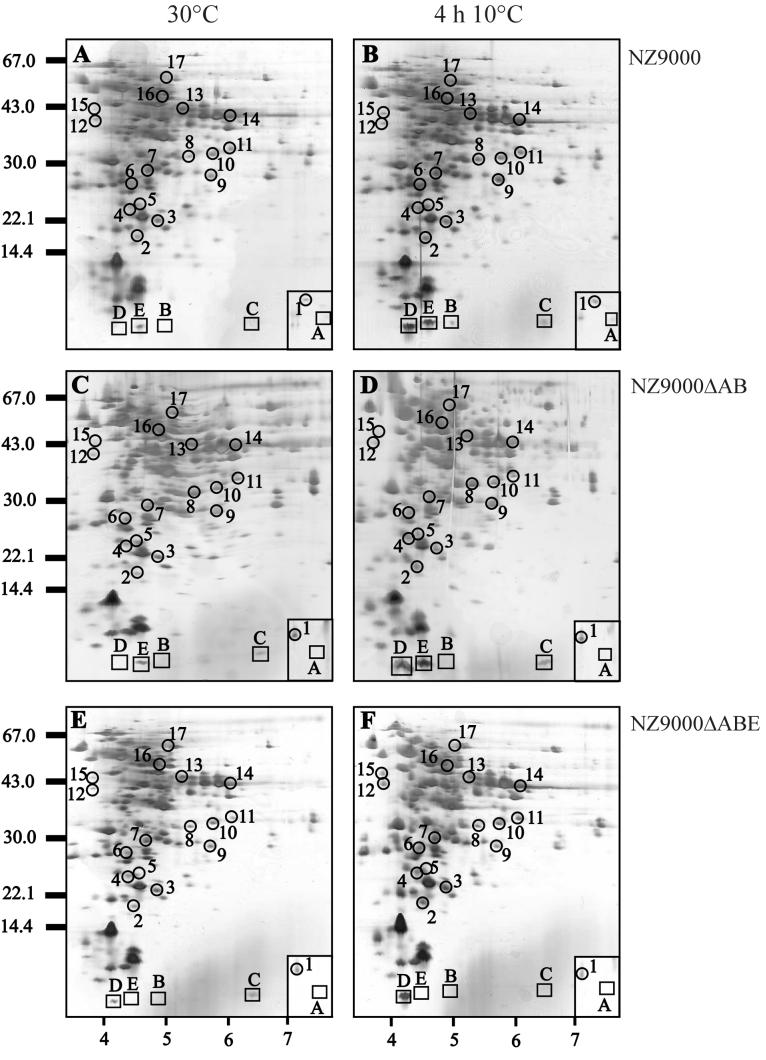
FIG. 3.
Protein analysis of cell extracts of strains NZ9000 (A and B), NZ9000ΔAB (C and D), and NZ9000ΔABE (E and F) by 2D-E. Cell extracts were isolated from these strains prior to cold shock (30°C mid-exponential phase) (A, C, and E) and at 4 h after cold shock to 10°C (B, D, and F) and were separated on a pI range of 3 to 10. Equal amounts of protein were loaded on the gel, and the proteins were visualized using silver staining. Molecular size markers are indicated on the left, and a pI scale is given at the bottom. The CSPs of L. lactis are boxed and have been identified previously (35). CIPs are circled and numbered as described previously (35). The box in the lower right corner of each gel indicates the region between pI values of approximately 9 and 10 of the same molecular weight. The N-terminal sequences of a number of spots are given in Table 2.

