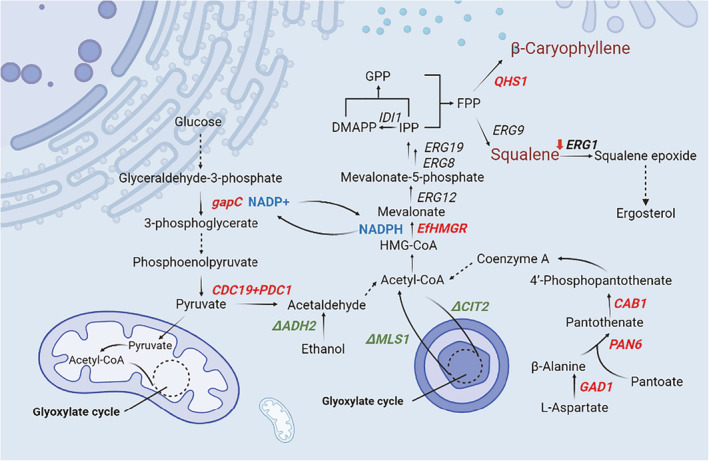
Fig. 1.

Strategies employed to enhance MVA pathway in Saccharomyces cerevisiae. Solid lines indicate each reaction step. Dashed lines represent the omission of more than one reaction step. The red bold fonts indicate overexpression of genes. The green bold fonts indicate knockout of genes. The blue bold fonts indicate NADPH regeneration. The red downward arrow indicates down‐regulation of ERG1 transcription.
