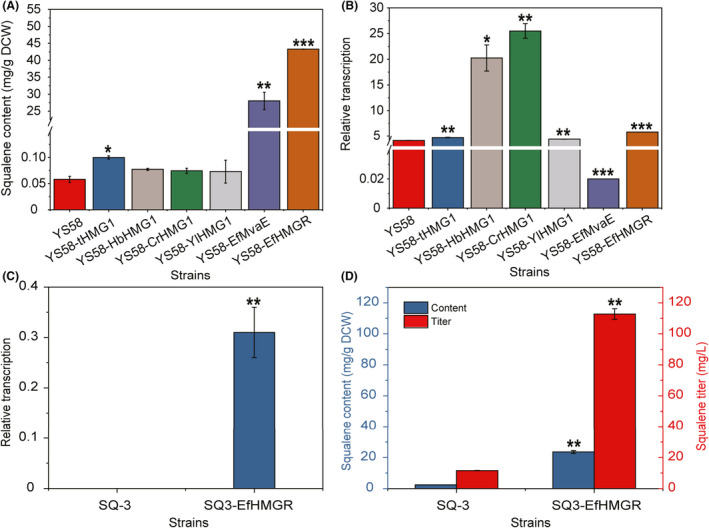
Fig. 2.

Screening of HMGR with high activity. (A) Squalene content. (B) Relative transcription levels of HMGR genes from different sources. (C) Relative transcription level of the truncated EfHMGR in industrial strains. (D) Squalene production of industrial yeast strains. Yeast cells were cultivated in YPD at 30°C for 24 h. Data are presented as the means of three biological replicates. Error bars represent standard deviations (n = 3). For significance analysis, results of strains YS58 (A, B) and SQ‐3 (C, D) were used as the controls. Student’s t‐test was used for statistical analysis (*P < 0.05; * *P < 0.01; ***P < 0.001).
