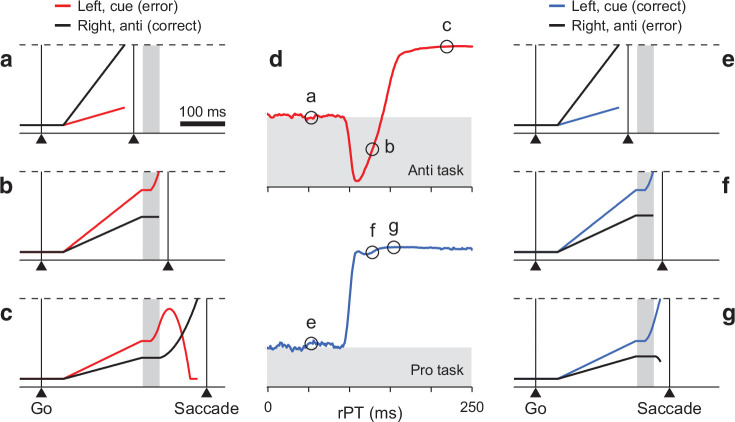
Figure 2. Turning a model of antisaccade performance into one of prosaccade performance.
(a–c) Three single antisaccade trials simulated with the CAS model. The cue is assumed to be on the left and the gap is 150 ms. Traces show motor plans toward the left (red, incorrect) and toward the right (black, correct) as functions of time. During the exogenous response interval (ERI, gray vertical shade), the plan toward the cue accelerates. After the ERI, the incorrect plan decelerates and the correct one accelerates. A saccade is triggered a short efferent delay after activity reaches threshold (dashed lines). Examples include a correct, short-rPT guess (a, rPT = 56 ms); an incorrect, captured saccade (b, rPT = 133 ms); and a correct, informed choice (c, rPT = 219 ms). (d) Simulated tachometric curves for the CAS (top, red) and CPS tasks (bottom, blue). The x and y axes correspond to raw processing time and fraction of correct choices, respectively. Gray shades indicate below-chance performance, where chance (white-gray border) is 50% correct. (e–g) Three single prosaccade trials with the same initial motor plans as in a–c but simulated with the CPS model. They include an incorrect, short-rPT guess (e, rPT = 56 ms); a correct, captured saccade (f, rPT = 133 ms); and a correct, informed choice (g, rPT = 149 ms). The pro- and antisaccade simulations differed only in the movement that was considered correct, which amounted to swapping the motor plans that were endogenously accelerated and decelerated.

