. 2022 Jul 11;11:e73245. doi: 10.7554/eLife.73245

Figure 2. Glutamate-oxaloacetate transaminase 2 (GOT2) knockdown (KD) induces reductive stress, which can be ameliorated by NADH turnover.

(A) Schematic of glycolytic signature induced by GOT2 KD-mediated NADH buildup and reductive stress. G6P: glucose-6-phosphate; F6P: fructose-6-phosphate; FBP: fructose-1,6-bisphosphate; DHAP: dihydroxyacetone phosphate; GA3P: glyceraldehyde-3-phosphate; PEP: phosphoenol pyruvate; oxPPP: oxidative pentose phosphate pathway; non-oxPPP: non-oxidative pentose phosphate pathway; X5P: xylulose-5-phosphate; R5P: ribose-5-phosphate; S7P: seduoheptulose-7-phosphate; HBP: hexosamine biosynthesis pathway; and GlcNAc-1P: N-acetylglucosamine 1-phosphate. (B) Relative fold changes in the indicated metabolites between PaTu-8902 ishGOT2.1 −Dox (n=3) and +Dox (n=3). 2PG: 2-phosphoglycerate; Pyr: pyruvate; and Lac: lactate. (C) Relative NADH/NAD+ ratio in PaTu-8902 ishGOT2.1 −Dox (n=3) and +Dox (n=3). (D) Relative colony formation of MIAPaCa-2 ishRNA −Dox (n=3) or +Dox (n=3) cultured in normal media (Dulbecco’s modified Eagle medium, DMEM) or DMEM with 1 mM pyruvate, normalized to −Dox for each condition. (E) Relative colony formation of MIAPaCa-2 ishGOT2.1 −Dox (n=3) or +Dox (n=3) cultured in normal media (DMEM) or DMEM with the indicated concentrations of pyruvate (mM), normalized to −Dox for each condition. (F) Relative proliferation of PaTu-8902 (left) and MIAPaCa-2 (right) ishGOT2.1 −Dox (n=3) or +Dox (n=3) cultured in normal media (DMEM) or DMEM with 1 mM Pyr or α-ketobutyrate (αKB), normalized to Day 0 for each condition. (G) Relative proliferation of PaTu-8902 (left) and MIAPaCa-2 (right) ishGOT2.1 −Dox (n=3) or +Dox (n=3) expressing doxycycline-inducible empty vector (EV), cytosolic Lactobacillus NADH oxidase (LbNOX), or mitochondrial LbNOX (mLbNOX), normalized to Day 0 for each condition. (H) Relative NADH/NAD+ ratio of PaTu-8902 (left) and MIAPaCa-2 (right) ishGOT2.1 −Dox (n=3) or +Dox (n=3) expressing EV, LbNOX, or mLbNOX. (I) Schematic of 13C3-pyruvate into relevant metabolic pathways. 13C-carbon labels in blue, non-labeled carbon in gray. LDH: lactate dehydrogenase; GPT: glutamate-pyruvate transaminase; MPC: mitochondrial pyruvate carrier; and PC: pyruvate carboxylase. (J–K) Fractional labeling of intracellular pyruvate (J) or lactate (K) in PaTu-8902 and MIAPaCa-2 ishGOT2.1 −Dox (n=3) or +Dox (n=3) cultured in 1 mM 13C3-pyruvate and treated with DMSO vehicle control or 5 µM UK5099 (MPC inhibitor). Unlabeled controls presented at right. For all panels, data represent mean ± SD. *p<0.05, **p<0.01, ***p<0.001, and ****p<0.0001.

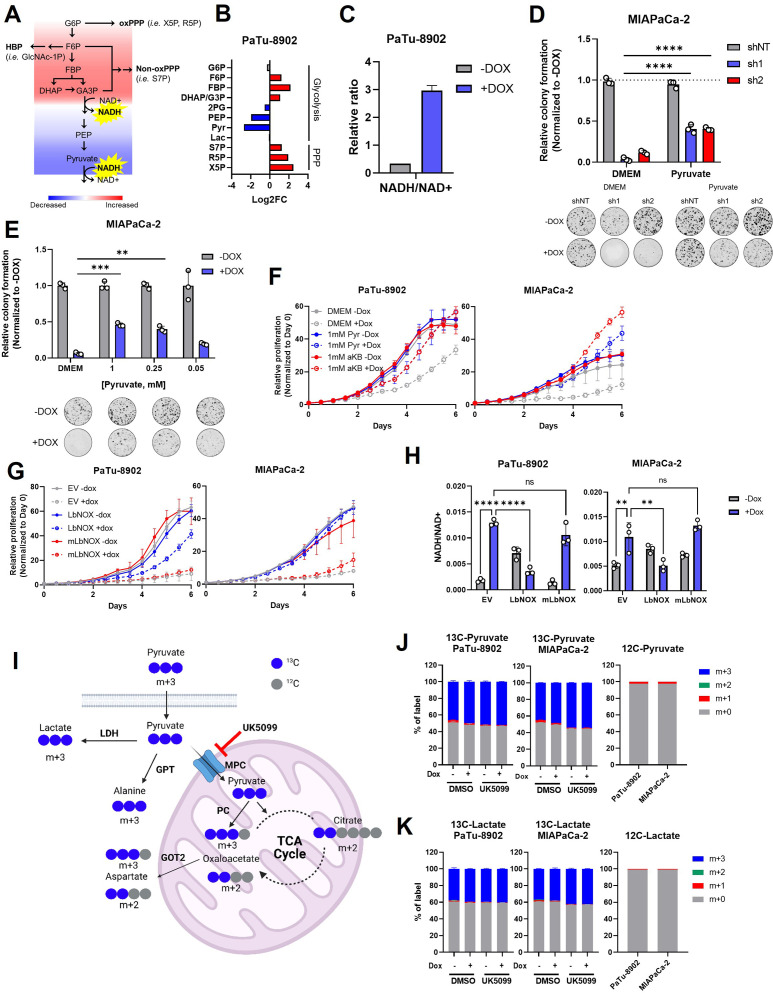
Figure 2.

Figure 2—figure supplement 1. GOT2 loss in vitro slows glycolysis and can be rescued by exogenous electron acceptors.

Figure 2—figure supplement 1.

(A) Glycolytic rate assay showing the proton efflux rate (PER) of PaTu-8902 ishGOT2.1 −Dox (n=4) or +Dox (n=4). (B–C) Relative proliferation (B) and ATP levels (C) of PaTu-8902 ishGOT2.1 −Dox (n=3) or +Dox (n=3) cultured in normal Dulbecco’s modified Eagle medium (DMEM) or DMEM with 1 mM pyruvate (Pyr). (D) Immunoblots of GOT2 and VINCULIN loading control in PaTu-8902 (top) and MIAPaCa-2 (bottom) parental (P), empty vector (EV), or two sgRNAs targeting GOT2 (sg1, sg2). (E) Relative colony formation of PaTu-8902 (left) and MIAPaCa-2 (right) P, EV, sgGOT2.1, or sgGOT2.2 cultured in normal DMEM (−Pyr, n=3) or DMEM with 1 mM pyruvate (+Pyr, n=3), normalized to +Pyr for each condition. (F) Relative colony formation of PaTu-8902 (left) and MIAPaCa-2 (right) ishGOT2.1 −Dox (n=3) or +Dox (n=3) cultured in normal media (DMEM) or DMEM with 1 mM α-ketobutyrate (αKB), normalized to −Dox for each condition. (G) Relative colony formation of MIAPaCa-2 ishGOT2.1 −Dox (n=3) or +Dox (n=3) cultured in normal media (DMEM) or DMEM with 1 mM Pyr, αKB, or nicotinaminde mononucleotide (NMN), normalized to −Dox for each condition. For all panels, data represent mean ± SD. *p<0.05, **p<0.01, ***p<0.001, and ****p<0.0001.
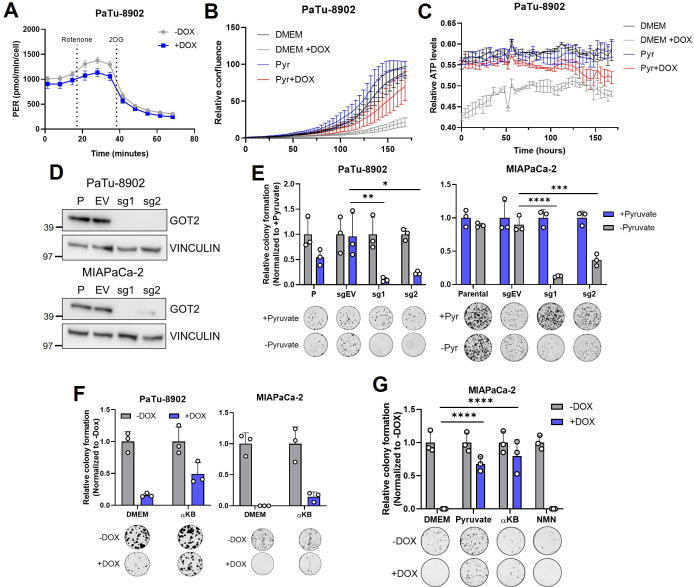
Figure 2—figure supplement 1—source data 1. Full western blot images for Figure 2—figure supplement 1D.
Figure 2—figure supplement 2. GOT2 KD can be rescued by cytosolic, but not mitochondrial, expression of LbNOX.

Figure 2—figure supplement 2.

(A) Immunoblots of glutamate-oxaloacetate transaminase 2 (GOT2), FLAG, and VINCULIN loading controls from PaTu-8902 (left) or MIAPaCa-2 (right) ishNT or GOT2.1 cells expressing doxycycline-inducible expression of empty vector (EV) or FLAG-tagged cytosolic Lactobacillus NADH oxidase (LbNOX) or mitochondrial LbNOX (mLbNOX). (B) Relative colony formation of PaTu-8902 (left) and MIAPaCa-2 (right) ishGOT2.1 −Dox (n=3) or +Dox (n=3) expressing EV, LbNOX, or mLbNOX, normalized to −Dox for each condition. (C) Relative proliferation of PaTu-8902 (top) and MIAPaCa-2 (bottom) ishNT −Dox (n=3) or +Dox (n=3) expressing EV, LbNOX, or mLbNOX and treated with dimethyl sulfoxide (DMSO) vehicle control (left) or 1 µM piericidin (right), normalized to Day 0 for each condition. (D) Ion abundances of NAD+ (left) and NADH (right) in PaTu-8902 (top) and MIAPaCa-2 (bottom) ishGOT2.1 −Dox (n=3) and +Dox (n=3). (E) Relative extracellular pyruvate/lactate ratios in PaTu-8902 (left) and MIAPaCa-2 (right) ishGOT2.1 −Dox (n=3) and +Dox (n=3). (F) Ion abundances of extracellular pyruvate (left) and lactate (right) in PaTu-8902 (top) and MIAPaCa-2 (bottom) ishGOT2.1 −Dox (n=3) and +Dox (n=3). (G) Heatmap of log2 fold changes in metabolite abundances between PaTu-8902 (left) and MIAPaCa-2 (right) ishGOT2.1 −Dox (n=3) and +Dox (n=3) expressing EV, LbNOX, or mLbNOX. G6P: glucose-6-phosphate; F6P: fructose-6-phosphate; FBP: fructose-1,6-bisphosphate; DHAP: dihydroxyacetone phosphate; 2PG: 2-phosphoglycerate; PEP: phosphoenol pyruvate; X5P: xylulose-5-phosphate; R5P: ribose-5-phosphate; S7P: seduoheptulose-7-phosphate; αKG: α-ketoglutarate; and P: pentose phosphate pathway. For all panels, data represent mean ± SD. *p<0.05, **p<0.01, ***p<0.001, and ****p<0.0001.
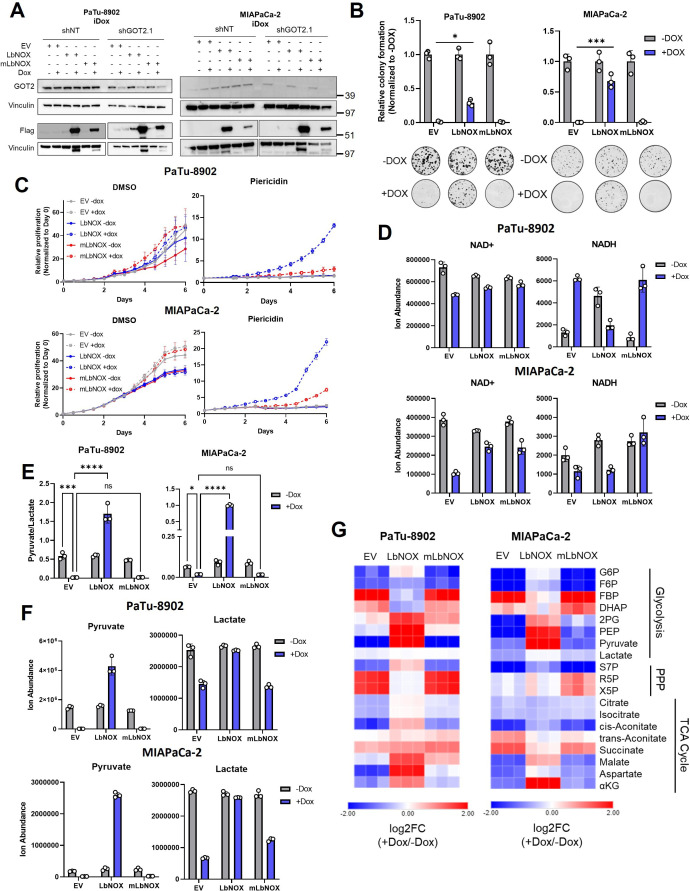
Figure 2—figure supplement 2—source data 1. Full western blot images for Figure 2—figure supplement 2A.
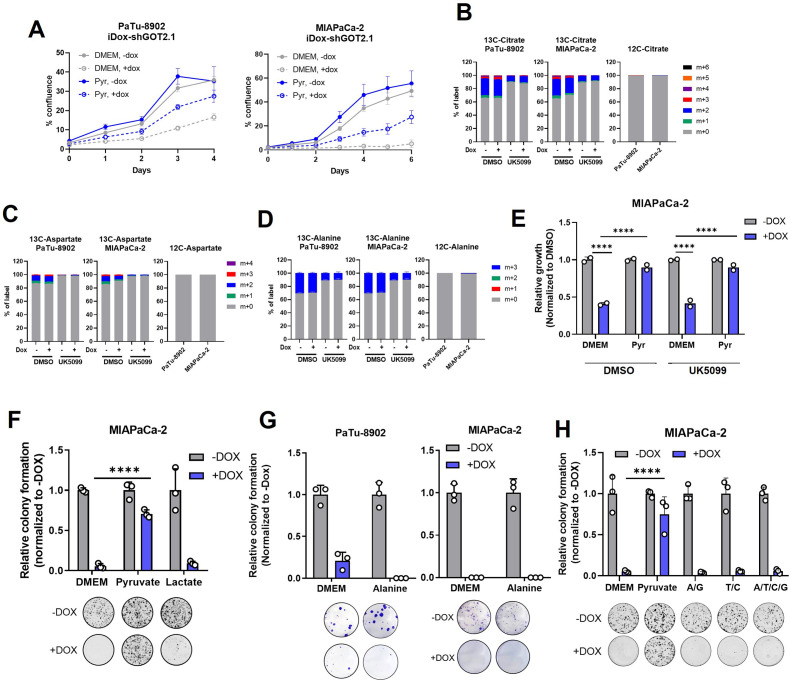
Figure 2—figure supplement 3. Cytosolic reduction of pyruvate to lactate is necessary for GOT2 KD.

Figure 2—figure supplement 3.

(A) Relative proliferation of PaTu-8902 (left) and MIAPaCa-2 (right) ishGOT2.1 −Dox (n=3) or +Dox (n=3) cultured in 1 mM glucose Dulbecco’s modified Eagle medium (DMEM) with 1 mM pyruvate (Pyr) normalized to Day 0 for each condition. (B–D) Fractional labeling of intracellular citrate (B), aspartate (C), or alanine (D) from 13C3-pyruvate (1 mM) in PaTu-8902 and MIAPaCa-2 ishGOT2.1 −Dox (n=3) or +Dox (n=3) treated with DMSO vehicle control or 5 µM UK5099 (mitochondrial pyruvate carrier (MPC) inhibitor). Unlabeled controls presented at right. (E) Relative cell number of MIAPaCa-2 ishGOT2.1 −Dox (n=3) or +Dox (n=3) cultured in normal DMEM or DMEM with 1 mM Pyr, treated with DMSO vehicle control or 5 µM UK5099, and normalized to DMSO for each condition. (F) Relative colony formation of MIAPaCa-2 ishGOT2.1 −Dox (n=3) or +Dox (n=3) cultured in normal DMEM or DMEM with 1 mM Pyr or lactate (Lac), normalized to −Dox for each condition. (G) Relative colony formation of PaTu-8902 (left) and MIAPaCa-2 (right) ishGOT2.1 −Dox (n=3) or +Dox (n=3) cultured in normal DMEM or DMEM with 1 mM alanine, normalized to −Dox for each condition. (H) Relative colony formation of MIAPaCa-2 ishGOT2.1 −Dox (n=3) or +Dox (n=3) cultured in normal DMEM or DMEM with either 1 mM Pyr or 100 µM of the indicated combinations of adenine (A), guanine (G), thymidine (T), and cytidine (C), normalized to −Dox for each condition. For all panels, data represent mean ± SD. *p<0.05, **p<0.01, ***p<0.001, and ****p<0.0001.