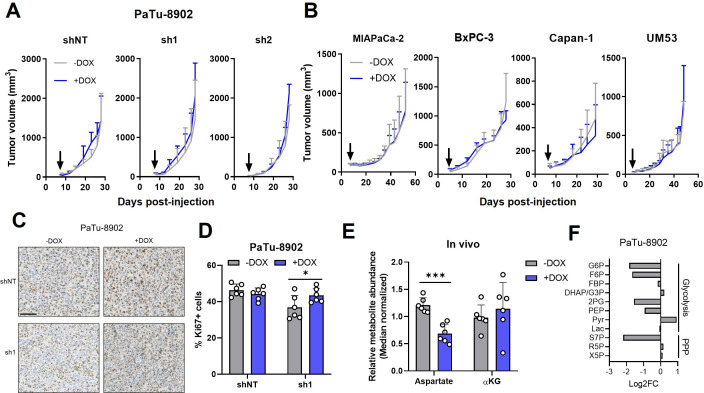
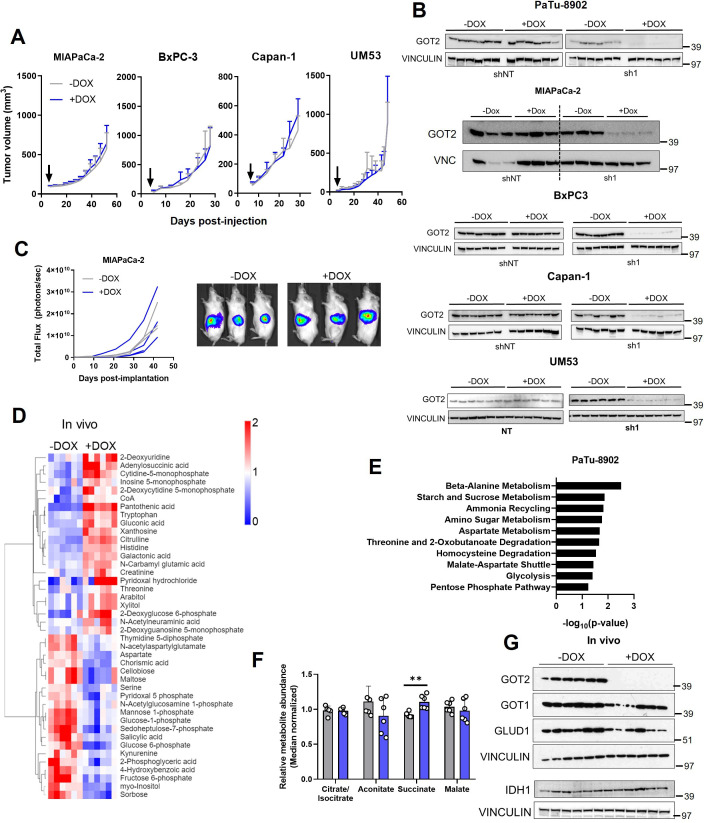
Figure 3. Glutamate-oxaloacetate transaminase 2 (GOT2) is not required for in vivo growth of pancreatic ductal adenocarcinoma (PDA) xenografts.
(A) Tumor volumes of PaTu-8902 ishRNA flank xenografts in NOD scid gamma (NSG) mice fed normal chow (−Dox, n=6) or doxycycline chow (+Dox, n=6). Arrows indicate administration of Dox chow 1 week after PDA cell injection. (B) Tumor volumes of four additional PDA cell line ishGOT2.1 flank xenografts in NSG mice fed normal chow (−Dox, n=6) or doxycycline chow (+Dox, n=6). Arrows indicate administration of Dox chow 1 week after PDA cell injection. (C) Immunohistochemistry for Ki67 in flank xenograft tissue from PaTu-8902 ishRNA −Dox (n=6) or +Dox (n=6). Scale bar is 100 µm. (D) Quantification of Ki67+ cells in tissue depicted in (C). (E) Relative abundances of Asp and αKG in PaTu-8902 ishGOT2.1 −Dox (n=6) or +Dox (n=6) flank xenografts. (F) Relative fold changes in the indicated metabolites between PaTu-8902 ishGOT2.1 −Dox (n=6) and +Dox (n=6) flank xenografts. G6P: glucose-6-phosphate; F6P: fructose-6-phosphate; FBP: fructose-1,6-bisphosphate; DHAP: dihydroxyacetone phosphate; GA3P: glyceraldehyde-3-phosphate; 2PG: 2-phosphoglycerate; PEP: phosphoenol pyruvate; Pyr: pyruvate; Lac: Lactate; X5P: xylulose-5-phosphate; R5P: ribose-5-phosphate; S7P: seduoheptulose-7-phosphate; and P: pentose phosphate pathway. For all panels, data represent mean ± SD. *p<0.05, **p<0.01, ***p<0.001, and ****p<0.0001.


