. 2022 Jul 11;11:e73245. doi: 10.7554/eLife.73245

Figure 6. MCT1 inhibition prevents pyruvate-mediated restoration of redox balance in vitro after loss of glutamate-oxaloacetate transaminase 2 (GOT2).

(A) Absolute quantitation of pyruvate (left) and lactate (middle), and the relative pyruvate/lactate ratio (right) in normal Dulbecco’s modified Eagle medium (DMEM), human cancer-associated fibroblasts (hCAF) conditioned media (CM), and mouse CAF (mCAF) CM. (B) Absolute quantitation of pyruvate (left) and lactate (middle), and the relative pyruvate/lactate ratio (right) in serum or the tumor interstitial fluid (TIF) from NOD scid gamma (NSG) mice harboring PaTu-8902 ishGOT2.1 −Dox (n=8 tumors, 4 mice) or +Dox (n=8 tumors, 4 mice) flank xenografts. (C) Relative proliferation of MIAPaCa-2 ishGOT2.1 −Dox (n=3) or +Dox (n=3) cultured with the absolute levels and relative ratios of pyruvate/lactate in hCAF and mCAF CM (left) or serum/TIF (right) from (A) and (B), normalized to Day 0 for each condition. (D) Relative colony formation of MIAPaCa-2 ishGOT2.1 −Dox (n=3) or +Dox (n=3) cultured in normal media (DMEM), 1 mM pyruvate, or hCAF CM, and treated with DMSO control or 100 nM AZD3965, normalized to −Dox for each condition. (E) Immunoblots of GOT2, MCT1, and VINCULIN loading control in PaTu-8902 ishGOT2.1 expressing empty vector (EV), or two sgRNAs targeting MCT1 (sg1, sg2). (F) Relative colony formation of PaTu-8902 ishGOT2.1 −Dox (n=3) or +Dox (n=3) expressing EV, or two sgRNAs targeting MCT1 (sg1, sg2) and cultured in the indicated doses of pyruvate, normalized to −Dox for each condition. (G) Ion counts of intracellular m+3 pyruvate (top) and lactate (bottom) in PaTu-8902 expressing EV, or two sgRNAs targeting MCT1 (sg1, sg2) and cultured in 1 mM 13C3-pyruvate for the indicated time points. (H) Relative proliferation of PaTu-8902 (top) and MIAPaCa-2 (bottom) ishGOT2.1 −Dox (n=3) or +Dox (n=3) cultured in normal DMEM or 0.25 mM pyruvate and treated with DMSO vehicle control or 25 µM FX11, normalized to Day 0 for each condition. For all panels, data represent mean ± SD. *p<0.05, **p<0.01, ***p<0.001, and ****p<0.0001.

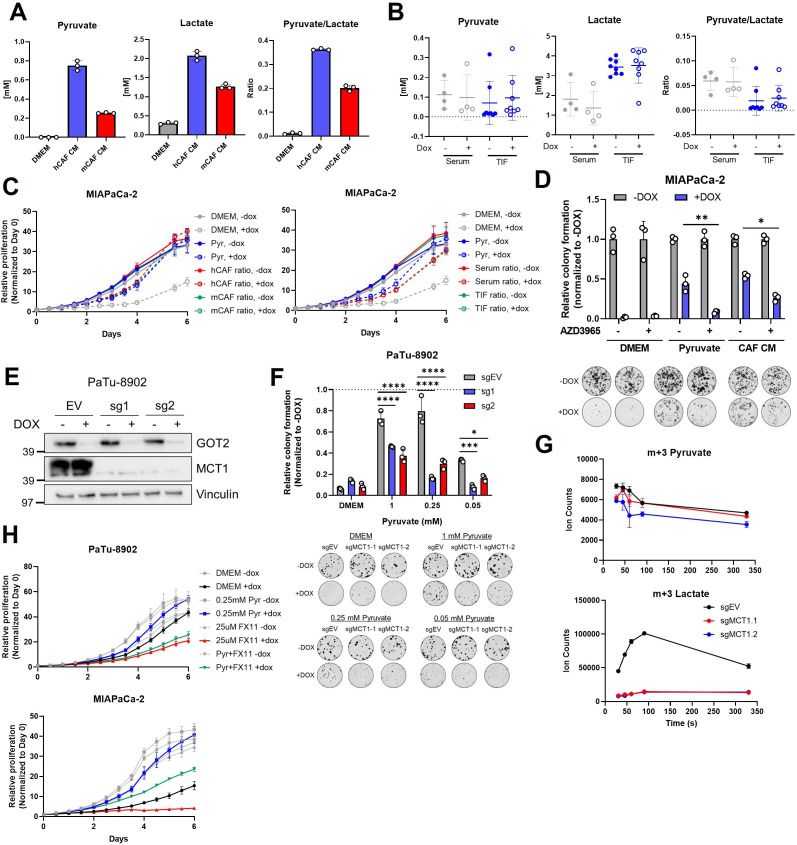
Figure 6—source data 1. Full western blot images for Figure 6E.

Figure 6.

Figure 6—figure supplement 1. MCT1 and LDHA inhibition dampen pyruvate rescue of GOT2 KD in vitro.

Figure 6—figure supplement 1.

(A) Relative Cancer Cell Line Encyclopedia (CCLE) mRNA expression of the indicated SLC16 family members in PaTu-8902 and MIAPaCa-2. (B) Immunoblot for MCT1 and VINCULIN loading control the indicated cell lines. (C) Single-cell RNA sequencing data from murine syngeneic orthotopic tumors showing expression of Slc16a1 (MCT1) and Slc16a3 (MCT4) in cancer-associated fibroblasts (CAF; marked by CDH11 expression) and epithelial (marked by Krt18 expression) populations. (D,F) Immunoblots for glutamate-oxaloacetate transaminase 2 (GOT2), MCT1, and VINCULIN in PaTu-8902 (D) and MIAPaCa-2 (F) ishGOT2.1 −Dox or +Dox expressing the indicated control (CTR) or constitutive MCT1-targeting shRNAs (sh1, sh2). (E,G) Relative proliferation of PaTu-8902 (E) and MIAPaCa-2 (G) ishGOT2.1 −Dox (n=3) or +Dox (n=3) expressing the indicated shRNAs and cultured in normal Dulbecco’s modified Eagle medium (DMEM; left), 0.25 mM pyruvate (middle), or human CAF (hCAF) CM (right), normalized to Day 0 for each condition. (H) Relative colony formation of MIAPaCa-2 ishGOT2.1 −Dox (n=3) or +Dox (n=3) cultured in normal media (DMEM) or the indicated doses of pyruvate, and treated with DMSO control or 100 nM AZD3965, normalized to −Dox for each condition. (I) Relative viability of MIAPaCa-2 cultured in normal media (DMEM), 0.25 mM pyruvate (left), or hCAF CM (right) and treated with DMSO vehicle control or 100 nM IACS-010759, alone or in combination with 100 nM AZD3965, normalized to −Dox for each condition. (J) Immunoblots for GOT2, LDHA, LDHB, and VINCULIN in PaTu-8902 and MIAPaCa-2 ishRNA. (K) Relative number of PaTu-8902 (left) and MIAPaCa-2 (right) ishGOT2.1 −Dox (n=3) or +Dox (n=3) cultured in normal DMEM, 0.25 mM pyruvate, or hCAF CM, and treated with DMSO vehicle control or 25 µM FX11, normalized to −Dox for each condition. For all panels, data represent mean ± SD. *p<0.05, **p<0.01, ***p<0.001, and ****p<0.0001.
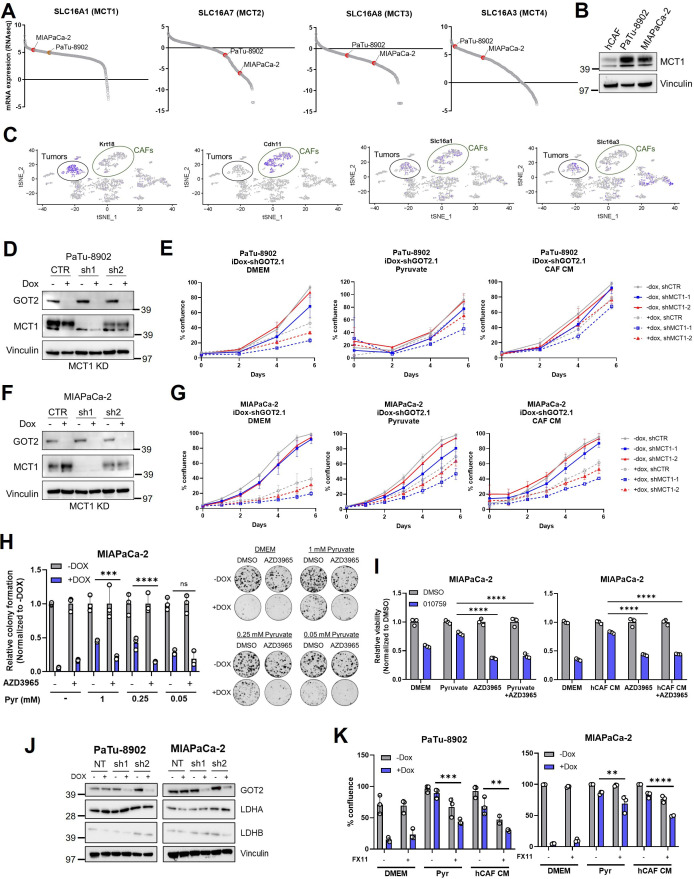
Figure 6—figure supplement 1—source data 1. Full western blot images for Figure 6—figure supplement 1B,D,F,J.
Figure 6—figure supplement 2. MCT1 inhibition does not sensitize tumors to GOT2 KD in vivo.

Figure 6—figure supplement 2.

(A,B) Tumor volume (left) and weight (right) of PaTu-8902 (A) and tumor volume of MIAPaCa-2 (B) ishGOT2.1 flank xenografts in NOD scid gamma (NSG) mice fed normal chow (−Dox, n=6) or doxycycline chow (+Dox, n=6) expressing control (shNT) or shMCT1.1. (C,D) Immunoblots for GOT2, MCT1, and VINCULIN in representative tumors from PaTu-8902 (C) or MIAPaCa-2 (D) ishGOT2.1 −Dox (n=3) or +Dox (n=3) flank xenografts with shNT or shMCT1.1. Each lane represents an individual tumor. (E) Tumor volume (left) and weight (right) of PaTu-8902 flank xenografts in NSG mice fed normal chow (−Dox, n=6) or doxycycline chow (+Dox, n=6) expressing control (sgEV) or sgMCT1.1. (F) Immunoblot for GOT2, MCT1, MCT4, and VINCULIN in representative, independent tumors from PaTu-8902 ishGOT2.1 −Dox (n=3) or +Dox (n=3) flank xenografts with sgEV or sgMCT1.1. (G) Immunoblot for GOT2, MCT1, MCT4, and VINCULIN in PaTu-8902 ishGOT2.1 −Dox or +Dox cell lines with sgEV or sgMCT1.1. For (F, G) blots, arrow = MCT1 band, asterisk = non-specific band. (H) Tumor volume (left) and weight (right) of PaTu-8902 flank xenografts in NSG mice fed normal chow (−Dox, n=6) or doxycycline chow (+Dox, n=6) treated with PBS control or 100 mg/kg AZD3965. (I) Immunoblot for GOT2, MCT1, and VINCULIN in representative, independent tumors of PaTu-8902 ishGOT2.1 −Dox (n=3) or +Dox (n=3) flank xenografts. (J) Weights of mice treated in (H). For all panels, data represent mean ± SD. *p<0.05, **p<0.01, ***p<0.001, and ****p<0.0001.
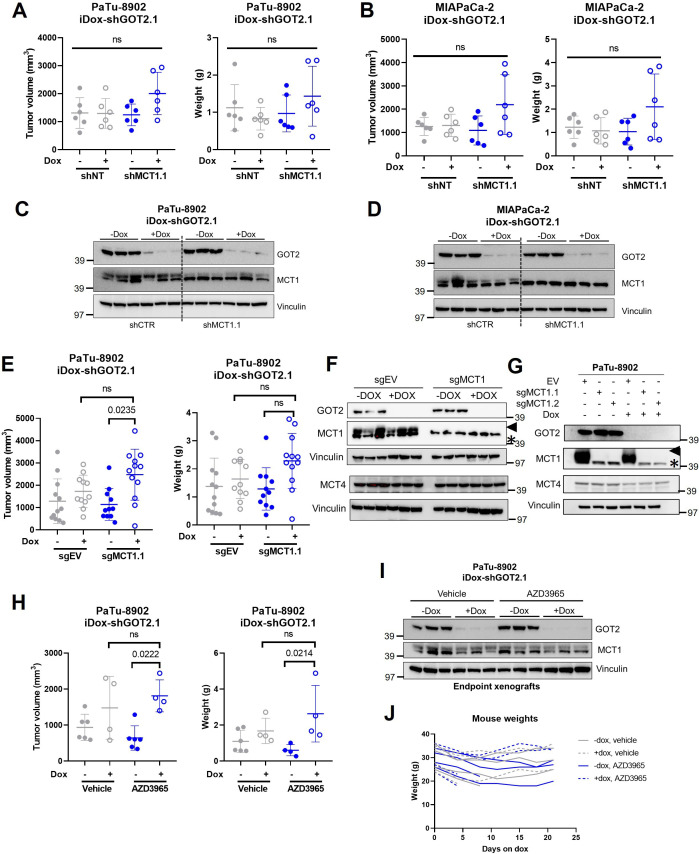
Figure 6—figure supplement 2—source data 1. Full western blot images for Figure 6—figure supplement 2C,D,F,G,I.
Figure 6—figure supplement 3. LDHA inhibition does not sensitize tumors to GOT2 KD in vivo.

Figure 6—figure supplement 3.

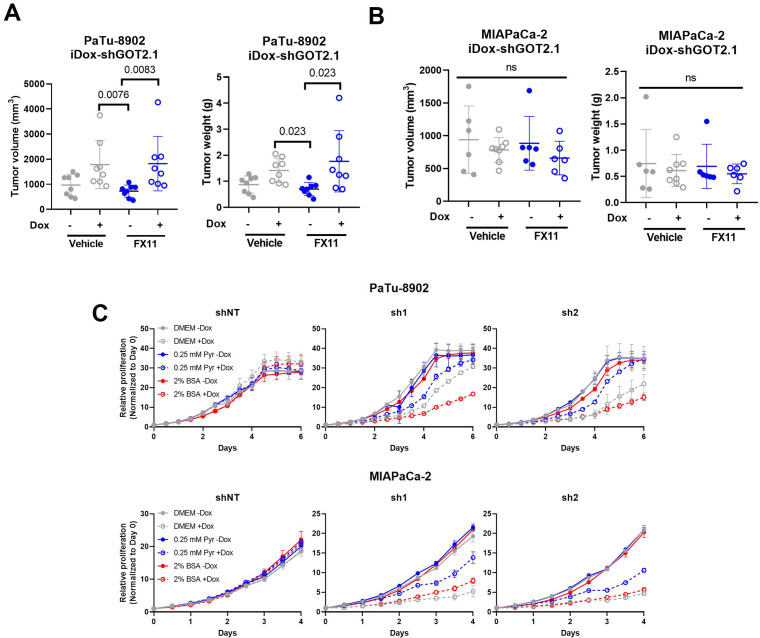
(A,B) Tumor volume (left) and weight (right) of PaTu-8902 (A) and MIAPaCa-2 (B) ishGOT2.1 flank xenografts in NOD scid gamma (NSG) mice fed normal chow (−Dox, n=6) or doxycycline chow (+Dox, n=6) and treated with PBS control or 2 mg/kg FX11. (C) Relative proliferation of PaTu-8902 (top) and MIAPaCa-2 (bottom) ishRNA −Dox (n=3) or +Dox (n=3) cultured in normal Dulbecco’s modified Eagle medium (DMEM), 0.25 mM pyruvate, or 2% BSA, normalized to Day 0 for each condition.