. 2022 Jul 5;11:e69430. doi: 10.7554/eLife.69430

Figure 5. The Oldest group has better event models in regions including visual cortex and auditory cortex, whereas the Youngest group has a better model-fit in PMC.

Regions with a significant model-fit difference between the youngest and oldest age group (at the optimal timescale for that region) are plotted on the cortical surface. Redder shades indicate that the event model fits improve with age, and bluer shades indicate that they weaken with age. The model fits for event models with different event durations are shown across all age groups and event durations in four example regions, selected post hoc for illustration. Error bars represent the standard deviation of model fit in the held out subjects, averaged across five cross-validated folds.

Figure 5.

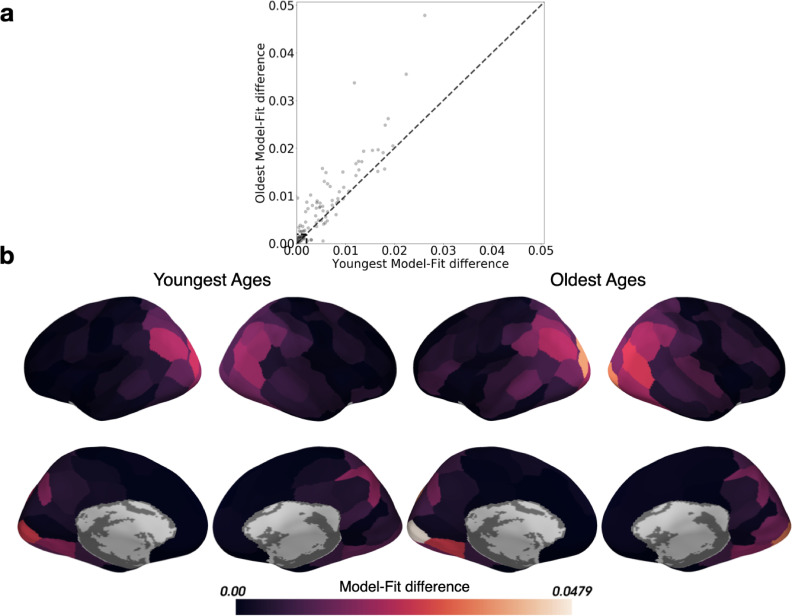
Figure 5—figure supplement 1. Comparing the model-fit difference for all parcels between the Youngest and Oldest ages.

Figure 5—figure supplement 1.

The model-fit difference is the difference in log-likelihood between the HMM for two events (expected to fit poorly), and the HMM with maximal model-fit (the best fitting number of events). (a) Parcels within the box in the lower left-hand corner of the scatter plot did not capture event structure in either age group (model fit differences smaller than 0.002), and were therefore excluded from the HMM-based analyses. (b) The model-fit difference is displayed in cortical parcels for both the Youngest and Oldest ages.

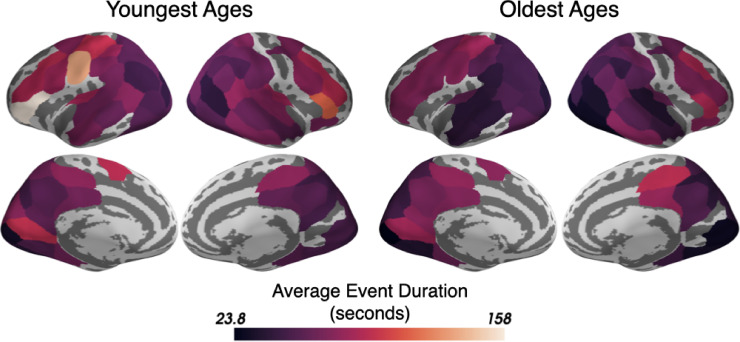
Figure 5—figure supplement 2. The best-fitting average duration of events for the optimal HMMs trained and tested on either the Youngest or the Oldest ages.

Figure 5—figure supplement 2.

The average event duration increases from sensory to association parcels for both age groups and the average event durations are highly correlated between the groups (r=0.78, RMS difference between groups = 12.3 seconds). Only parcels that had good model-fits in at least one age group (see Figure 1—figure supplement 2) are shown.

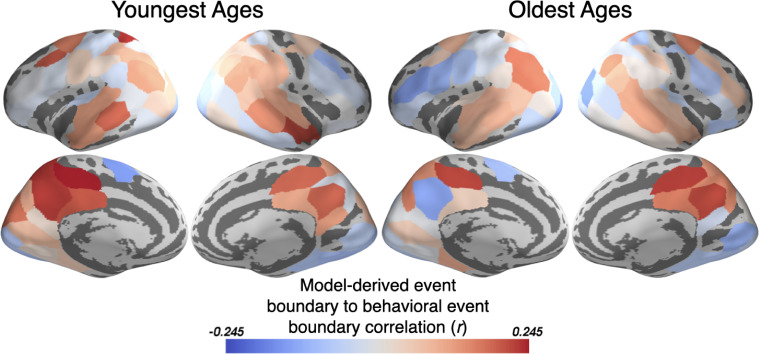
Figure 5—figure supplement 3. The HMM-derived event boundaries correlate with behaviorally estimated event boundaries from children.

Figure 5—figure supplement 3.

The event boundaries determined by the HMM jointly-fit to both the Youngest and Oldest groups correspond to behaviorally estimated event boundaries in association regions such as PMC, TPJ, and precuneus. All parcels for which a jointly fit HMM was modeled are displayed.