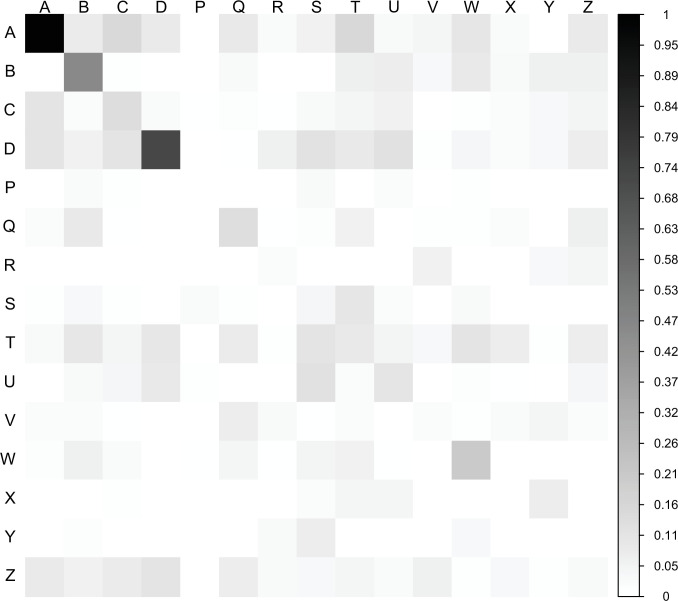
Appendix 1—figure 2. Ward-to-ward transmission matrix.
The matrix indicates the sum of transmission events across all posterior trees from cases in ‘infector’ wards (vertical axis) to cases in ‘infectee’ wards (horizontal axis). The degree of shading is proportional to the estimated posterior number of transmissions for each ward-to-ward pair. Outbreak wards: A–D; non-outbreak wards: P–Z (Z is ‘all wards’).

