. 2022 Jul 19;11:e76854. doi: 10.7554/eLife.76854

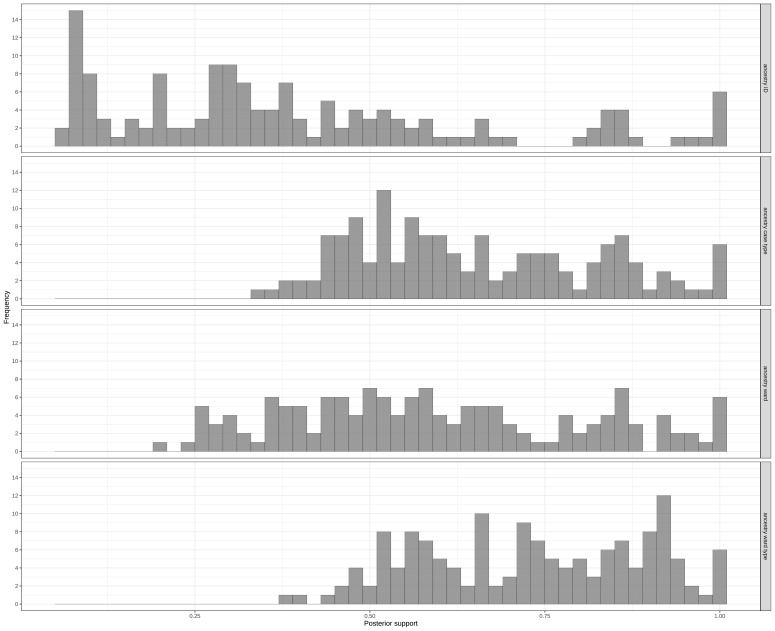
Figure 3. Distribution of posterior support of maximum posterior ancestry for all cases, according to identity of (A) individual ancestor, (B) ancestor’s case type (i.e. , ‘HCWcovid’, ‘HCWoutbreak’, ‘patientnoso’, and ‘patientcommunity’), (C) ancestor’s ward, and (D) ancestor’s ward type (i.e., ‘outbreak ward’, ‘non-outbreak ward’).

Figure 3.

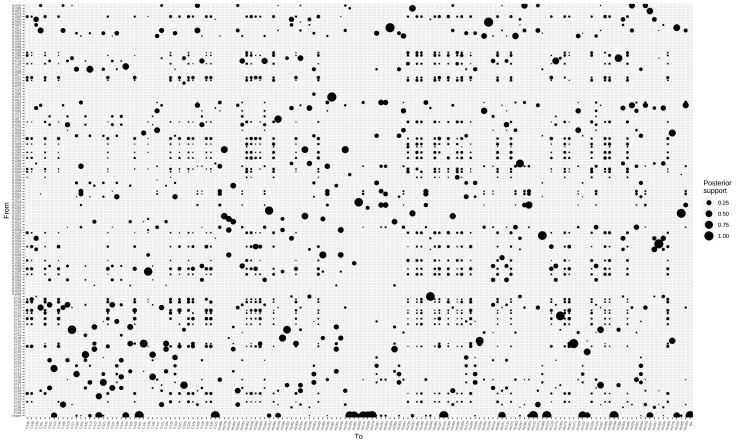
Figure 3—figure supplement 1. Ancestry reconstruction (who infected whom) of the outbreaker2 model.

Figure 3—figure supplement 1.

Infectors are on the vertical axis and infectees are on the horizontal axis. Each bubble represents the posterior probability of each infector-infectee transmission pair. The bottom row denotes the probability that an infectee was in fact an imported case. Patients and employees are named C1xx and H10xx, respectively.
Figure 3—figure supplement 1—source code 1. Interactive ancestry plot (who infected whom) – identical to Figure 3—figure supplement 1.
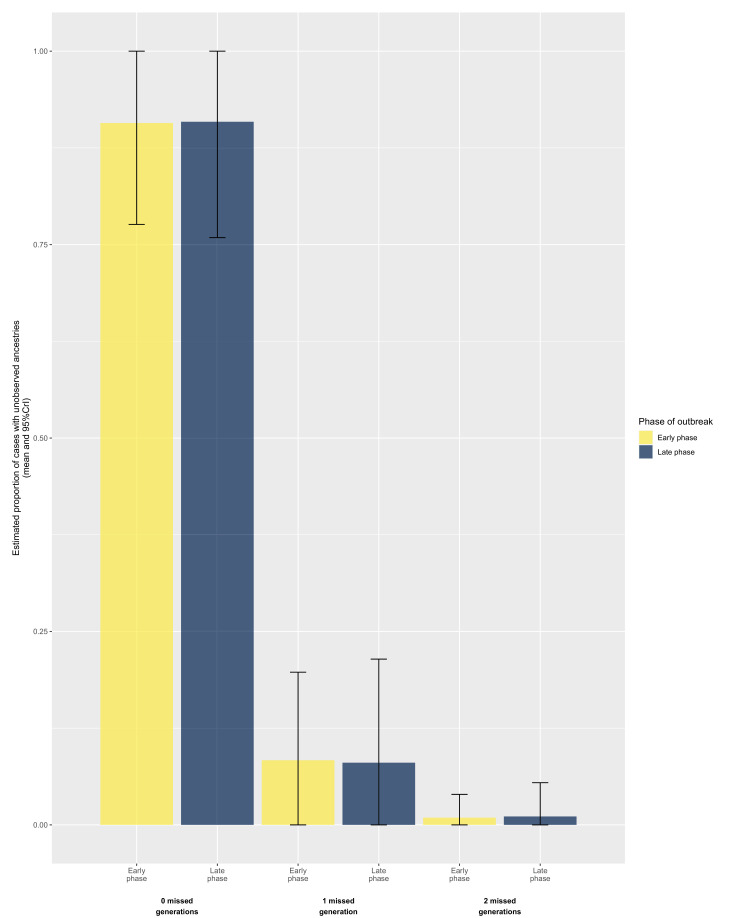
Figure 3—figure supplement 2. Distribution of number of missed generations across posterior trees, stratified by phase of outbreak.

Figure 3—figure supplement 2.

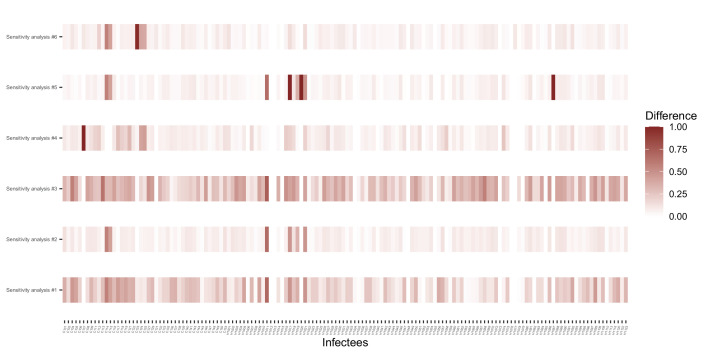
Figure 3—figure supplement 3. Comparison of the accuracy of ancestry attribution of each sensitivity analysis.

Figure 3—figure supplement 3.

Each case is on the horizontal axis. The shading corresponds to a value indicating the magnitude of the difference in attribution of the case’s ancestor and the main analysis. For each infectee (case), we calculated the absolute difference in probabilities of infectors (ancestor) between the main analysis and each sensitivity analysis. Values of difference 1 indicate 100% difference in ancestry attribution, and 0 indicate absolute agreement. Sensitivity analysis #1: absence of contact data. Sensitivity analysis #2: longer serial interval (mean 5.2 days, SD 4.7).Sensitivity analysis #3: contacts were based on human resources data for HCWs and on infectious and susceptible periods. Sensitivity analysis #4: patients are considered to be no longer infectious after the date of the positive RT-PCR for SARS-CoV-2. Sensitivity analysis #5: higher value (3) for the threshold for identification of outliers. Sensitivity analysis #6: default value (5) for the threshold for identification of outliers. HCW, healthcare worker.