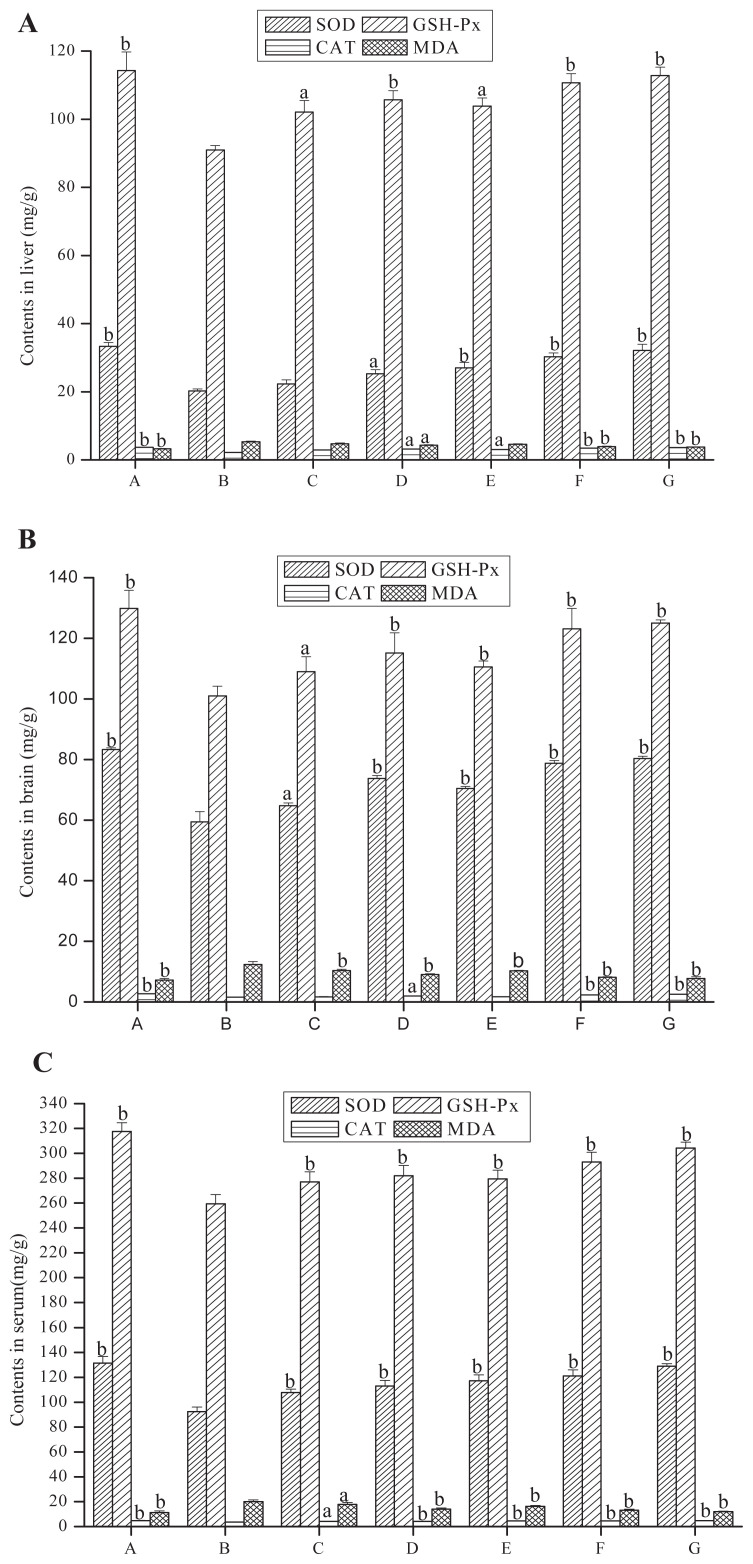
Figure 3.
Effects of polysaccharides on superoxide dismutase (SOD), glutathione peroxidase (GSH-PX), and catalase (CAT) activities and malondialdehyde (MDA) contents in (A) liver, (B) brain, and (C) serum of aging model mice. A = normal control group; B = negative control group; C = low-dose of TPP-1 group; D = high-dose of TPP-1 group; E = low-dose of PTPP-1 group; F = high-dose of PTPP-1 group; G = positive control group.

