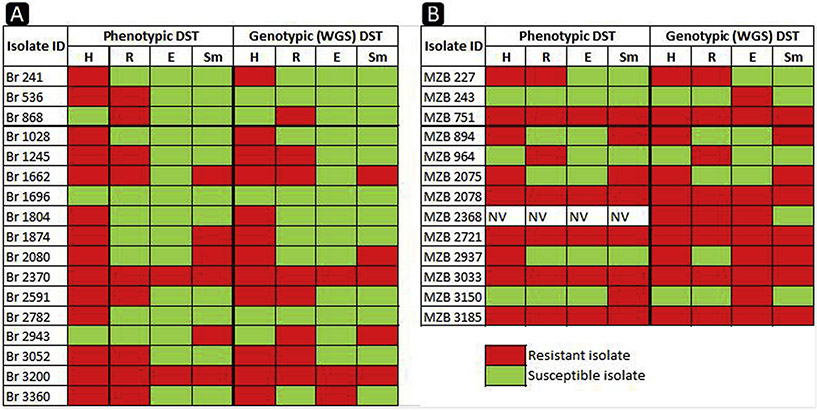
Fig. 1.
Heat-map of the resistance profile comparing the phenotypic and WGS DST results. Red color indicates drug resistance and green color indicates drug sensitivity. H: isoniazid; R: rifampicin; E: ethambutol; Sm: streptomycin; NV: not valid phenotypic test. Br: isolates from Brazil, MZB: isolates from Mozambique.

