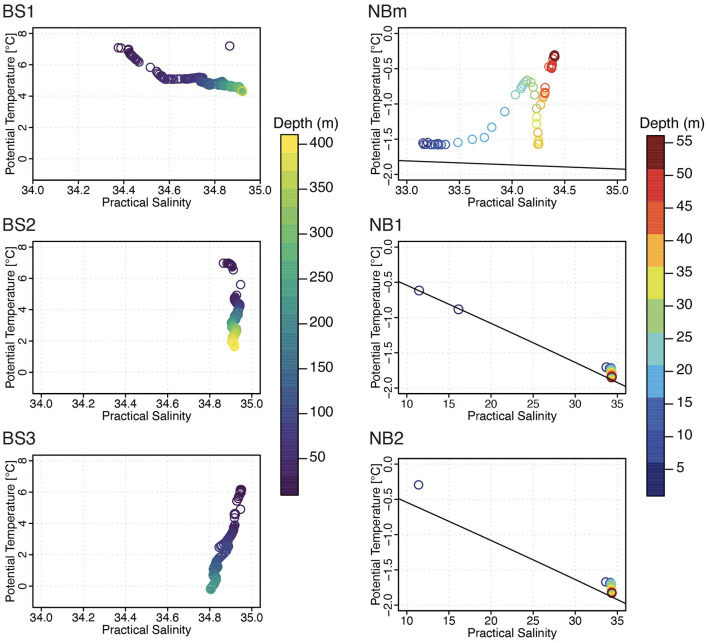
Figure 2.
A comparison of the marine physical environment using potential temperature-practical salinity diagram per sampling station. The water column depth (m) is denoted by color legend. Only surface water profile was recorded in NBm, NB1, and NB2 stations. Note the different range of scales at NBm (sea-ice margin) and NB1 and NB2 (sea-ice covered) stations.

