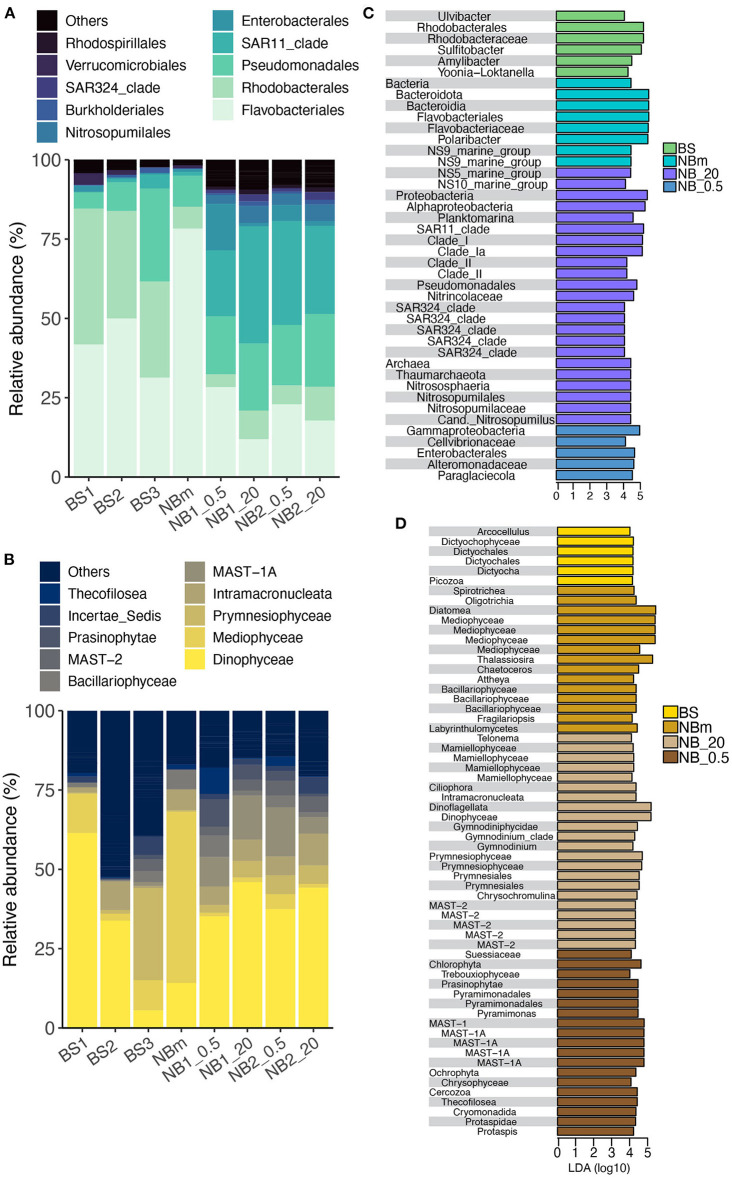
Figure 3.
Comparison of prokaryotic and microeukaryotic members of the surface marine microbiomes sampled across the study's transect. The taxonomic profile of the most abundant prokaryotes (A) and microeukaryotes (B) retrieved from Amplicon Sequence Variants (ASVs) tables specified at the order and class taxonomic rank level, respectively. Prokaryotes (C) and microeukaryotes (D) identified from the LEfSe analysis at all taxonomic levels that describe the differences between each community grouped by environment type: BS, Barents Sea communities in open water environment; NBm, Nansen Basin margin community in sea-ice edge environment; NB_.5, Nansen Basin communities at the interface environment between sea-ice and surface water; NB_20, Nansen Basin communities in sea-ice covered environment. The x-axis is the LDA score (log 10) that indicates the scale of difference between groups.

