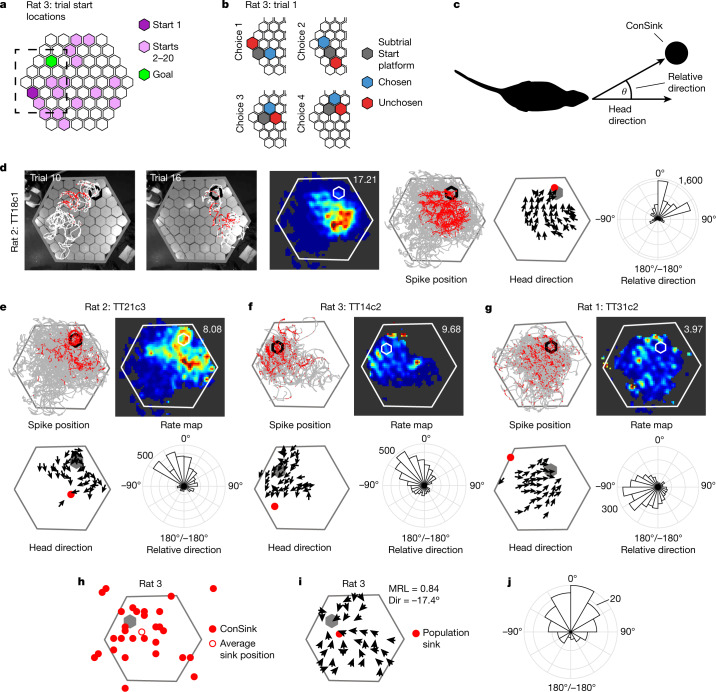
Fig. 1. ConSinks and vector fields organize place cell activity during navigation on the honeycomb maze.
a, Maze showing all start platforms and the goal platform for rat 3. The dashed box indicates the portion of the maze shown in b. b, Schematic of the four choices making up trial 1. The animal is confined at the ‘subtrial start’ until two adjacent platforms are raised and makes its choice by moving onto the ‘chosen’ platform. c, The animal’s heading direction relative to a reference point (the ConSink) is calculated as the angle between the straight-ahead head direction (0°) and the direction of the point in egocentric space. d, Representative example of a ConSink place cell. Left two panels, paths (white) and spikes (red) fired during two individual trials of the task. The perimeter of the goal platform is shown in black. Middle two panels, place field heat map (maximal firing rate (Hz) indicated at top right) and all paths (grey) and spikes (red). Second from right, vector field depicting mean head direction at binned spatial positions. The ConSink is depicted as a filled red circle. Right, polar plot showing the distribution of head directions relative to the ConSink. e–g, Additional examples as in d. h, ConSinks from rat 3 plotted over the maze showing a wide distribution across and off the maze (see Extended Data Fig. 6a for results from the other four animals). A grey hexagon represents the goal platform. i, Average vector fields for rat 3 (see Extended Data Fig. 6b for results from the other four animals). MRL, mean resultant length; Dir, mean relative direction. j, The mean relative directions of all significant ConSinks were non-uniformly distributed (Rayleigh test: z = 22.19, P = 9.81 × 10⁻¹¹), with a mean direction of −6.20° (not significantly different from 0° (one-sample test for mean angle, P < 0.05); 95% confidence interval = −10.3º, 22.67º).

