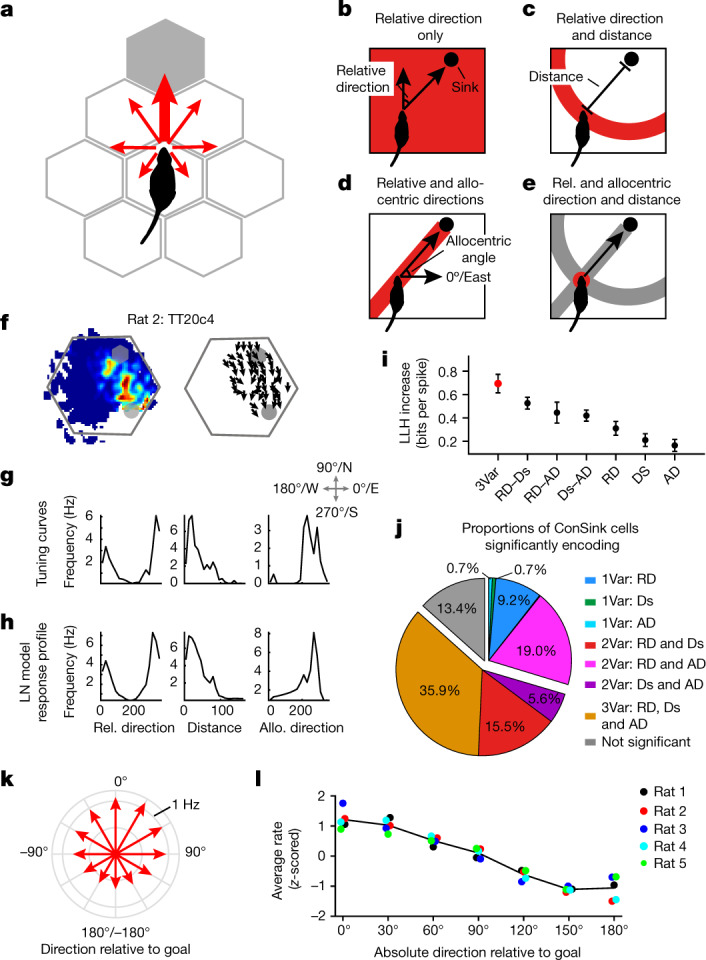
Fig. 3. ConSink population firing patterns contain enough spatial information to solve the honeycomb maze navigation problem.

a, A simple fantail model predicts that firing rate vectors will be maximum in the direction of the goal and fall off monotonically with increasing angle from the goal. b–e, The information necessary to construct the goal direction vector consists of all or certain combinations of the relative direction (b) and distance (c) to the ConSink and absolute direction relative to the environment (d), which together produce the goal direction vector (e). f–h, Typical CA1 place cell with significant information coding for all three variables with raw tuning curves (g) and LN model response profiles (h). i, For the cell in f, the combination of all three types of information provides more information than any other combination (LLH, log-likelihood; 3Var, 3 variables; RD, relative direction; Ds, distance; AD, allocentric direction). n = 10 repeats of the cross-validation procedure. Error bars, s.e.m. j, Percentages of ConSink cells encoding different combinations of the three variables in the LN model. k, Fantail data: population firing rate vectors across the five animals (red arrows) varying monotonically as a function of the angle between each platform direction and the population goal vector (Rayleigh test of non-uniformity of distribution, P = 0; mean direction = 10.9º). l, Population vectors for each animal conform to this model. Individual points correspond to the fantail vectors from each animal; note that positive and negative directional (for example, 30º and –30º) vectors are averaged. The black line represents the average across the five animals.
