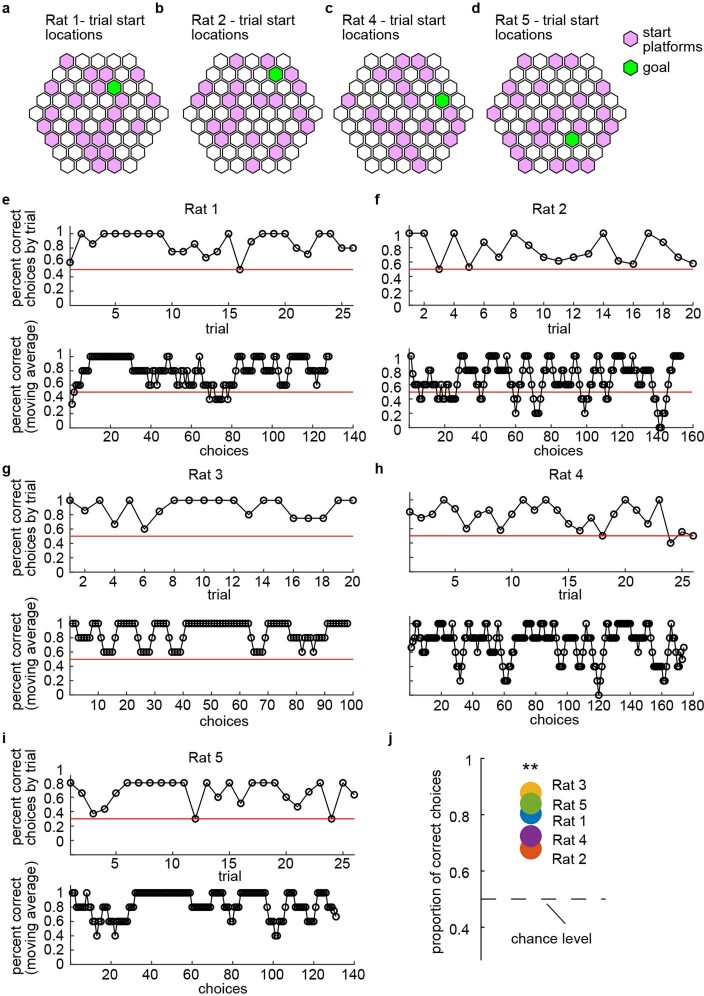
Extended Data Fig. 1. Behavioural Summary.
a, Schematic of the honeycomb maze showing all start platforms and the goal platform from Rat 1’s session. b-d, Same as is in (a) but for Rats 2, 4, and 5, respectively. e, Top panel, Percentage of choices that were correct averaged by trial for Rat 1. Bottom panel, Running average of correct choices (every 5 consecutive choices). f-i, As in (e) but for Rats 2 to 5, respectively. j, The total proportion of correct choices for each rat. Each rat made significantly more correct than incorrect choices; two-sided binomial test within each animal, p = 5.17 x 10⁻⁵, 1.03 x 10⁻⁵, 5.96 x 10⁻¹⁵, 1.32 x 10⁻⁴, 9.16 x 10⁻¹⁶ for rats 1–5, respectively.

