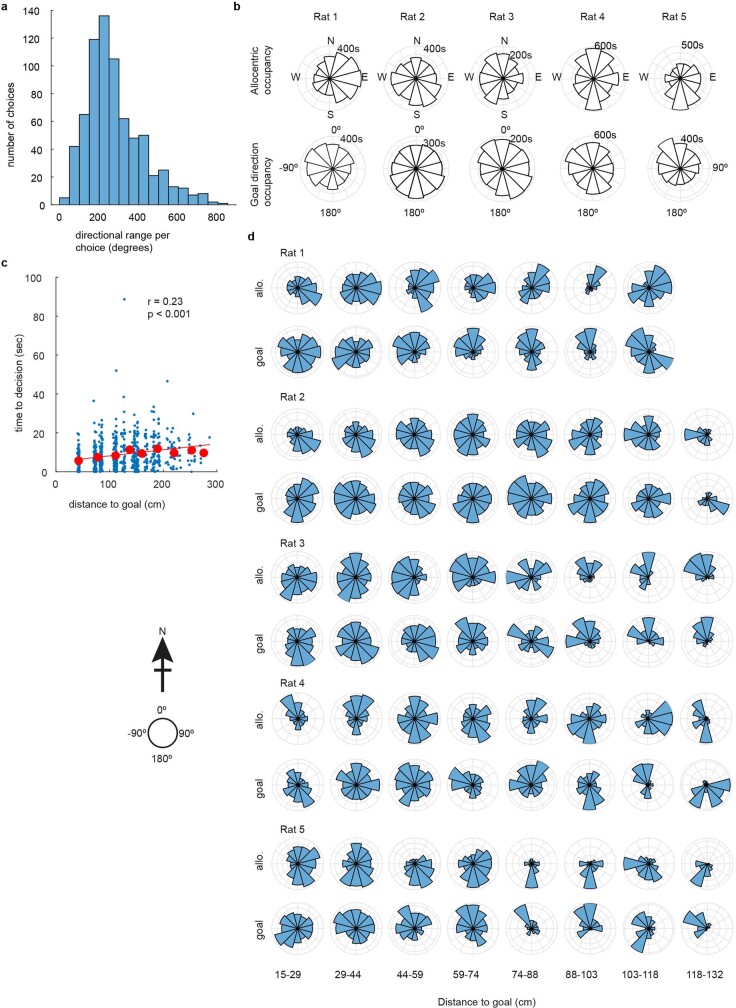
Extended Data Fig. 3. Rats sample a large range of possible directions while navigating the honeycomb task.
a, Histogram showing the directional range covered by the animals per choice from the time when the platforms begin to rise to the time when the animal moves to the next platform. Note that ranges greater than 360º indicate that the animal continued to scan in the same direction (i.e. multiple rotations); if an animal scanned 360º and then counter-rotated back to the starting direction, range is calculated only as 360º. b, Allocentric (allo.) and relative-to-goal (goal) directional occupancy for each animal. Note that goal direction is not oversampled. c, The time the animals take to make their decision decreases as they get closer to goal (one sample t test, t(723) = 6.27, p = 5.94 x 10⁻¹⁰); however, this does not seem to prevent them sampling the full range of direction at short-goal distances (d).

