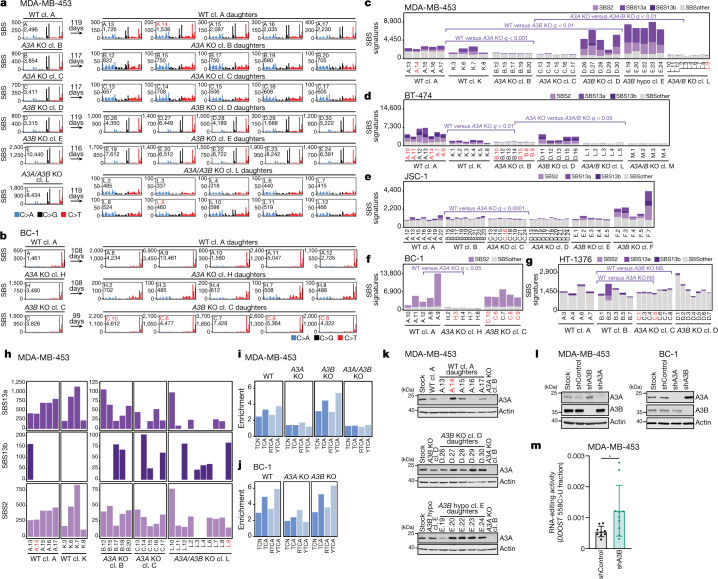
Fig. 3. APOBEC3 deaminases drive the acquisition of SBS2 and SBS13 in human cancer cells.
a,b, Mutational profiles of the indicated MDA-MB-453 (a) and BC-1 (b) clones plotted as the numbers of genome-wide substitutions (y axis) at cytosine bases classified into 48 possible trinucleotide sequence contexts (x axis; Extended Data Fig. 4a). cl., clone. The arrows indicate the number of days spanning the cloning events of parents (left of arrow) and daughters (right) during which mutation acquisition was tracked. c–g, The numbers of SBSs attributed to colour-coded mutational signatures discovered in the indicated daughter clones from the MDA-MB-453 (c), BT-474 (d), JSC-1 (e), BC-1 (f) and HT-1376 (g) cell lines with the indicated genotypes. q values comparing cumulative counts of SBS2, SBS13a, and SBS13b were calculated using one-tailed Mann–Whitney U-tests and false-discovery rate (FDR)-corrected using the Benjamini–Hochberg procedure. hypo, hypomorph. h, Focused plots showing SBS2 and SBS13a/b burdens in the indicated daughter clones. i,j, Enrichment of cytosine mutations in APOBEC3B-preferred RTCA and APOBEC3A-preferred YTCA sequence contexts in the indicated MDA-MB-453 (i) and BC-1 (j) daughter clones. R, purine base; Y, pyrimidine base; N, any base. k,l, Immunoblotting using anti-APOBEC3A (01D05), anti-APOBEC3B and anti-actin antibodies in the indicated cell lines. m, Quantification of DDOST 558C>U levels in the indicated MDA-MB-453 cells. Data are mean ± s.d. Statistical analysis was performed using two-tailed Student’s t-tests; *P < 0.05. n = 9 experiments. Clones marked in red font were excluded from statistical tests (Methods). Data from additional cell lines are shown in Extended Data Figs. 6 and 7.

