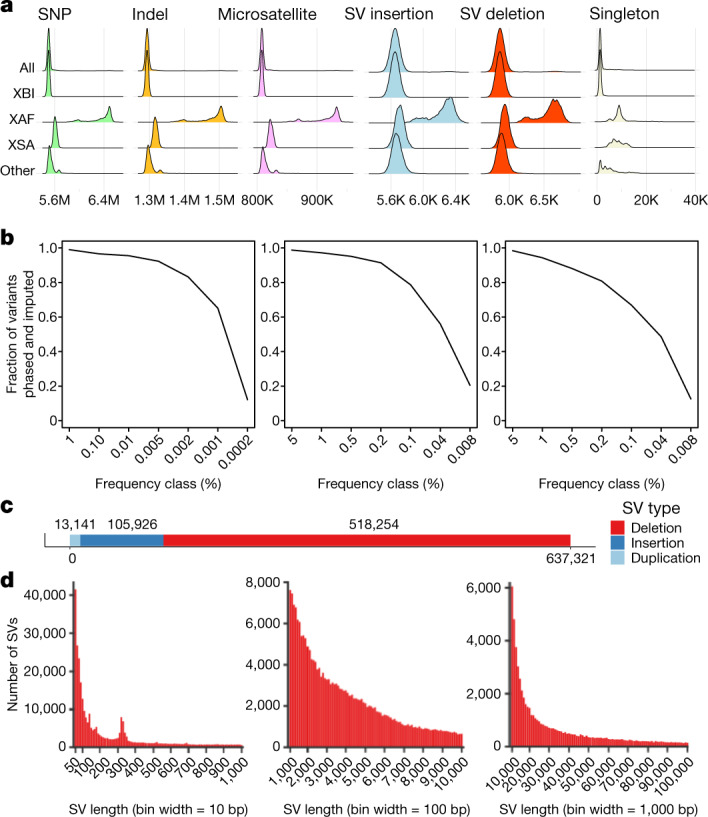
Fig. 4. Variant call set.

a, Number of SNPs, indels, microsatellites, SV insertions, SV deletions and singleton SNPs carried per diploid genome of individuals in the overall set and partitioned by population. b, Imputation accuracy in the three populations: XBI (left), XAF (middle) and XSA (right). A variant was considered imputed if ‘leave one out r2’ of phasing was greater than 0.5 and imputation information was greater than 0.8. The x axis splits variants into frequency classes based on the number of carriers in the sequence dataset. Variants are split by variant type. c, Number of SVs discovered in the dataset by variant type. d, Length distribution of SVs, from 50 to 1,000 bp, 1,000 to 10,000 bp and 10,000 to 100,000 bp.
