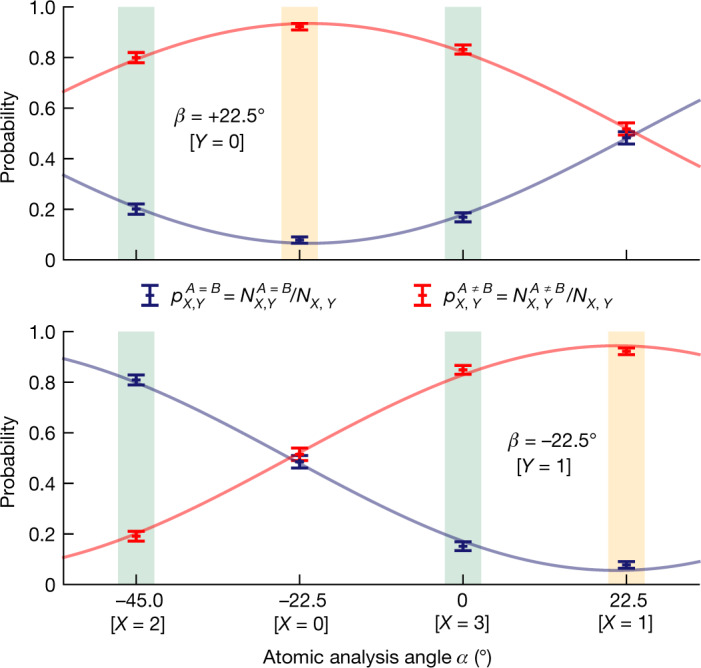
Fig. 4. Atom–atom state correlations.

The correlations EX,Y are obtained from the correlation (blue) and anticorrelation (red) probabilities of the device outputs for the eight input combinations. The data are fitted with sinusoidal functions estimating visibilities of 0.869(25) and 0.888(45). The settings for X = 2 or X = 3 (green background) contribute to the evaluation of the Bell parameter S = 2.578(75), whereas the QBER Q = 0.078(9) follows from settings with X = Y (yellow background). The error bars indicate statistical errors of one standard deviation. N = 3,342.
