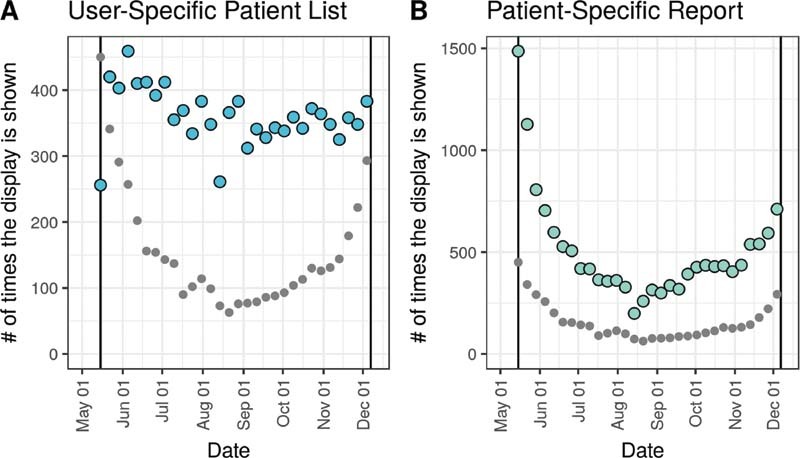
Fig. 2.

Adoption and sustained use of two communication channels available to clinicians. Colored dots represent the weekly total number of times the score was displayed to any user via each display channel, either a personal or shared patient list ( A ) or the patient-specific report of COVID-19 information ( B ). The weekly census of hospitalized COVID-19 patients is shown with grey dots for reference (calculated as the number of unique encounters scored by the system in that week).
