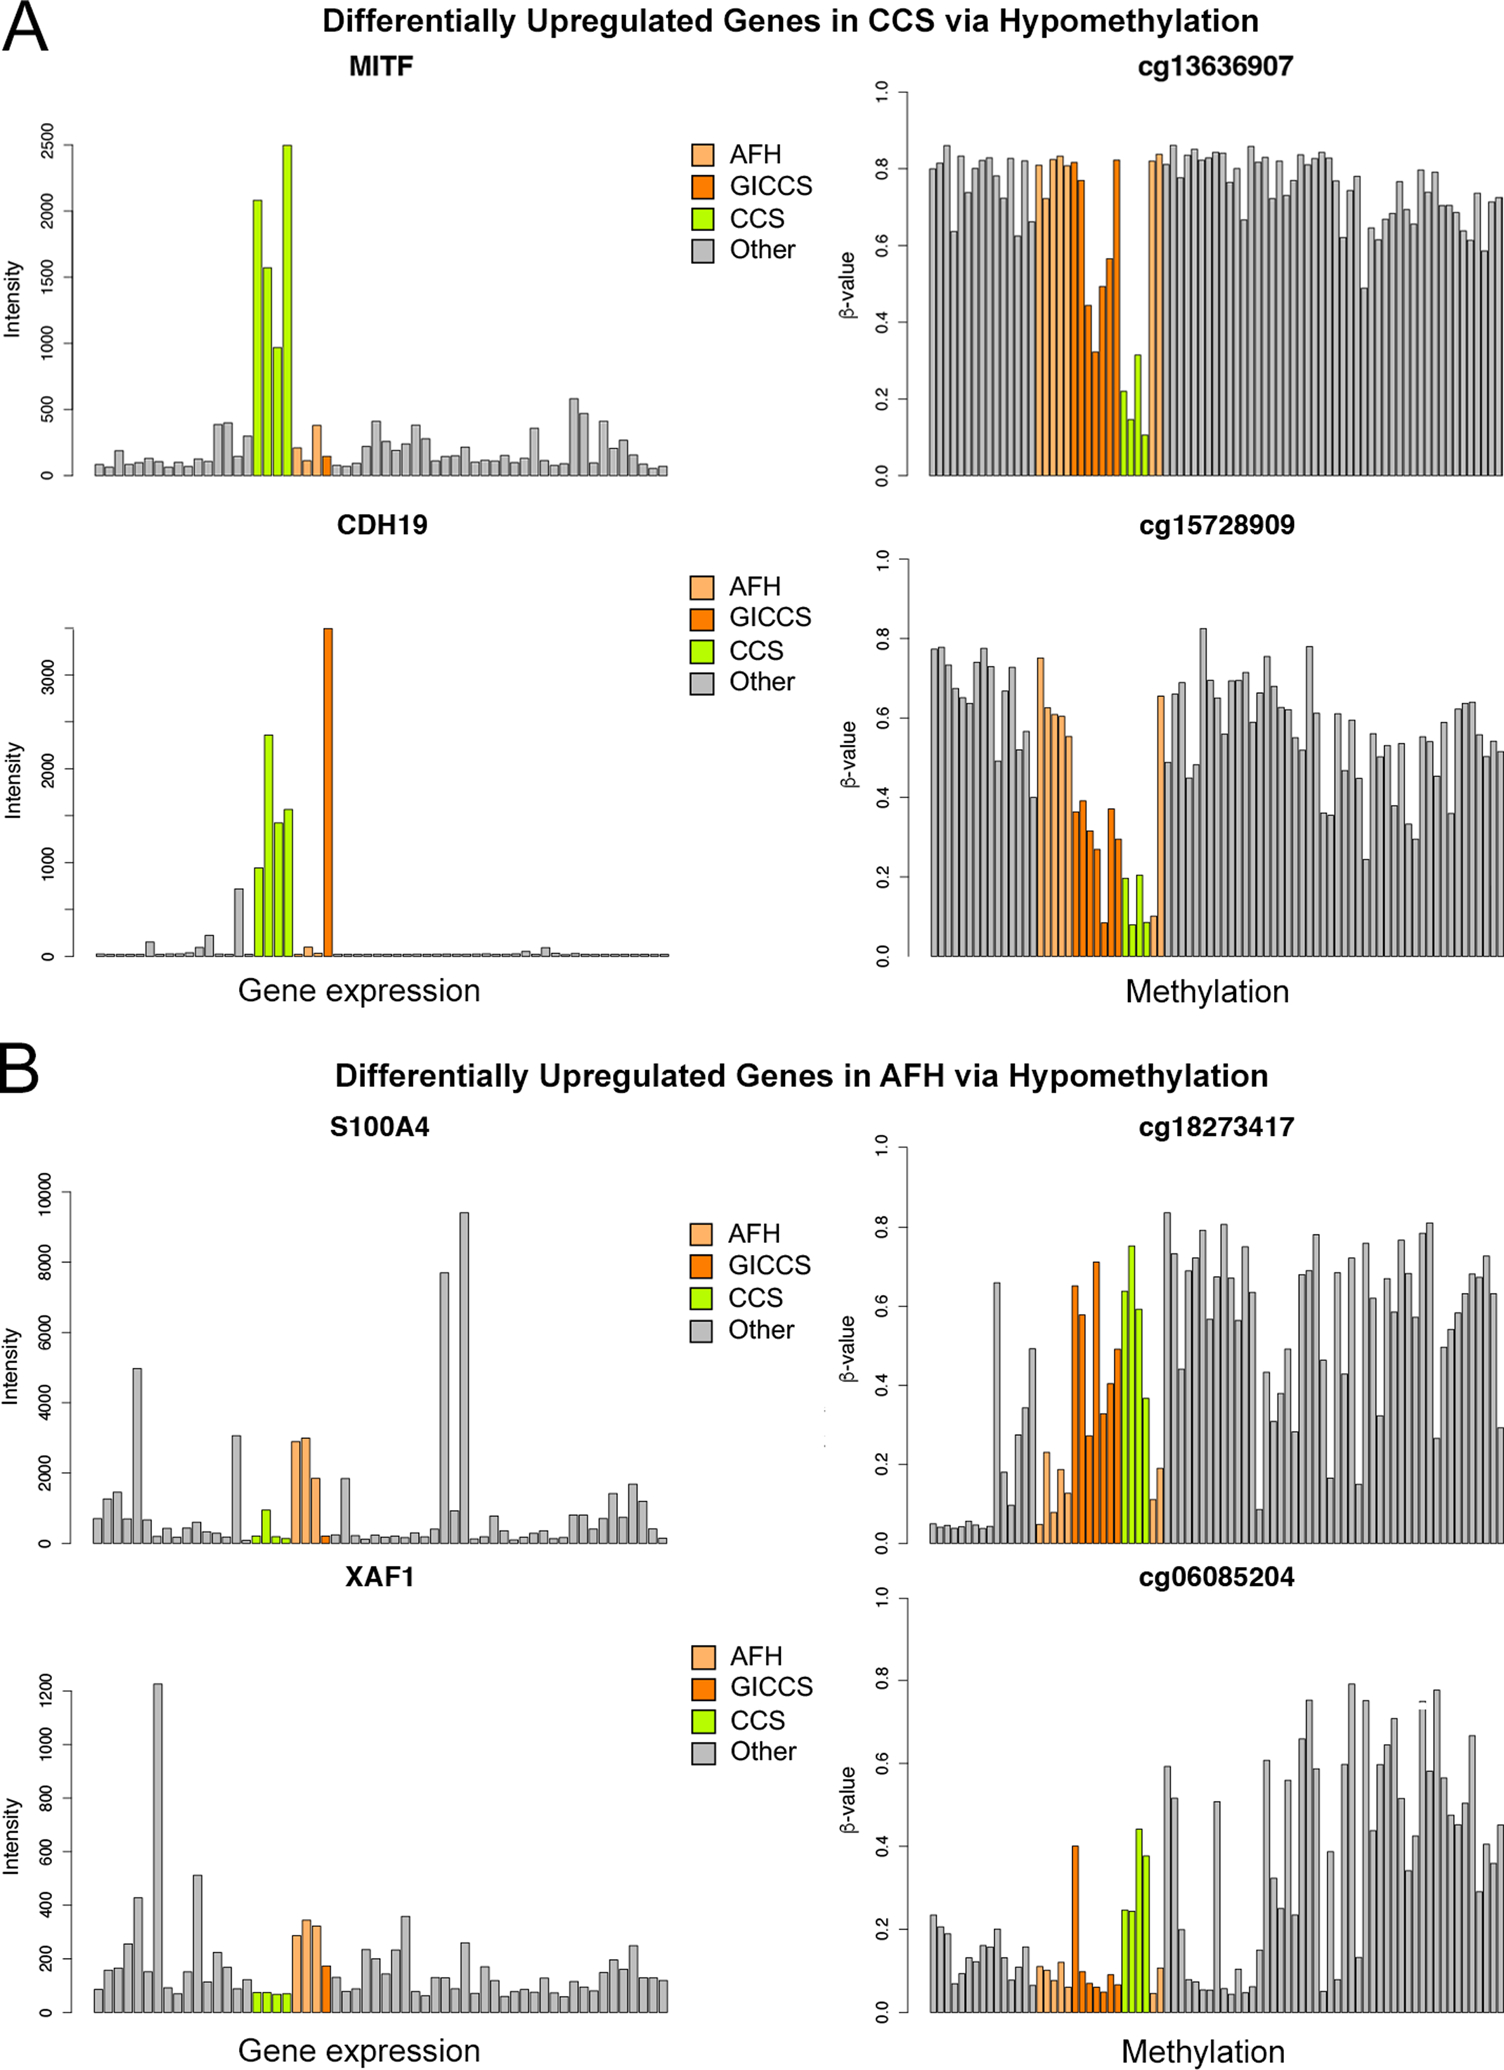
Figure 4.

Differential gene upregulation corresponding to hypomethylation on matched CpG sites in CCS (A) and AFH (B). Affymetrix U133A was performed comparing 3 AFH, 4 CCS cases, and 1 GICCS to a group of 44 tumors of various histotypes and 6 normal tissues, using log2-fold change threshold of 1 and P < 0.01. Infinium 850k methylation array was performed comparing 7 AFH, 4 CCS, 4 GICCS to a group of 29 tumors of various histotypes and 8 normal tissues, using a log2-fold change threshold of 2 and P < 0.01. Differentially expressed genes were matched to CpG site identified by a unique cg identifier in the format of cg#. The numbers of CpG sites assigned to each of these 4 genes on the 850k array were as follows: 8 for S100A4, 14 for XAF1, 27 for MITF, and 3 for CDH19. Out of these, the numbers of CpG sites that showed negative correlation with gene expression are as follows: 3 for S100A4, 6 for XAF1, 3 for MITF, and 3 for CDH19. The most representative CpG site from each gene is displayed in this figure. Abbreviations—AFH: angiomatoid fibrous histiocytoma; CCS: clear cell sarcoma; GICCS: clear cell sarcoma-like tumor of gastrointestinal tract.
